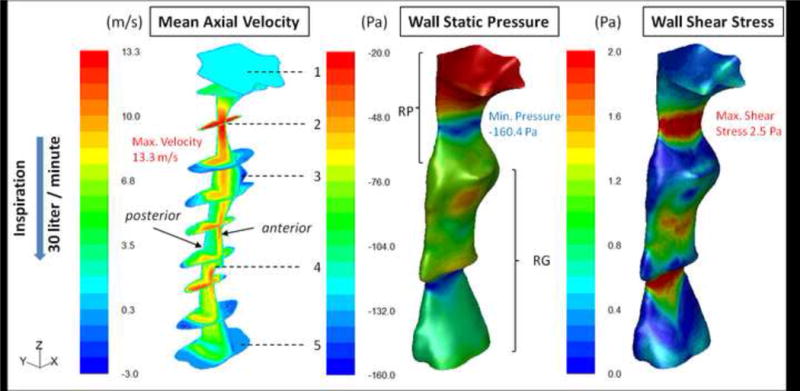
Figure 2.

SDB Patient #5: Pre-operative distributed contour values of three airflow variables, which from left to right respectively are: mean axial velocity (m/sec); mean wall static pressure (Pa) and wall shear stress (Pa). Calculations performed with steady-state RANS (k-ω SST model) during inspiration. The axial velocity field is shown inside the airway’s volume using a sagittal mid-plane and ten cross-sectional planes. The numbering from 1 to 5 are area zones as in Figure 1. The static pressure and shear stress distributions are presented on the airway wall. The narrowest sites (behind the palate and epiglottis) correspond to the sites of maximum velocity (red area), minimum static pressure (greatest negative pressure, blue area), and maximum wall shear stress (red area). The coordinate system to the left of the color bar is used for orientation purposes; z-axis in the direction of the flow and x-axis in the anterior-posterior direction.
