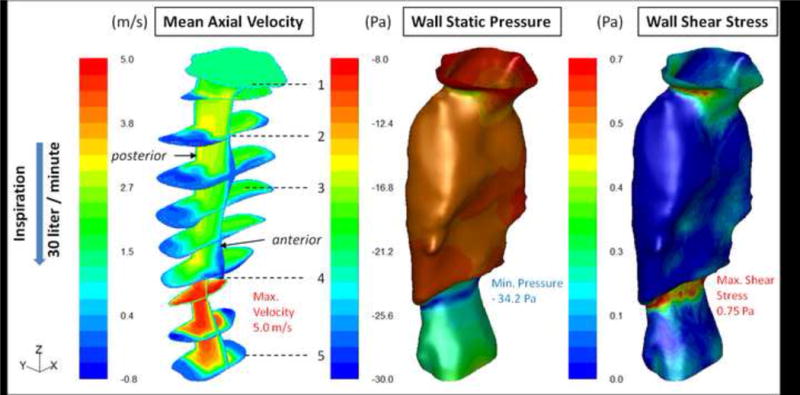
Figure 3.

SDB Patient #5: Post-treatment distributed contour values of mean axial velocity (m/sec), mean wall static pressure (Pa), and mean wall shear stress (Pa) as calculated with steady-state RANS (k-ω SST model) during inspiration. There is a more homogeneous distribution of the wall static pressure and wall shear stress values as compared with the pre-treatment case presented in Figure 2.
