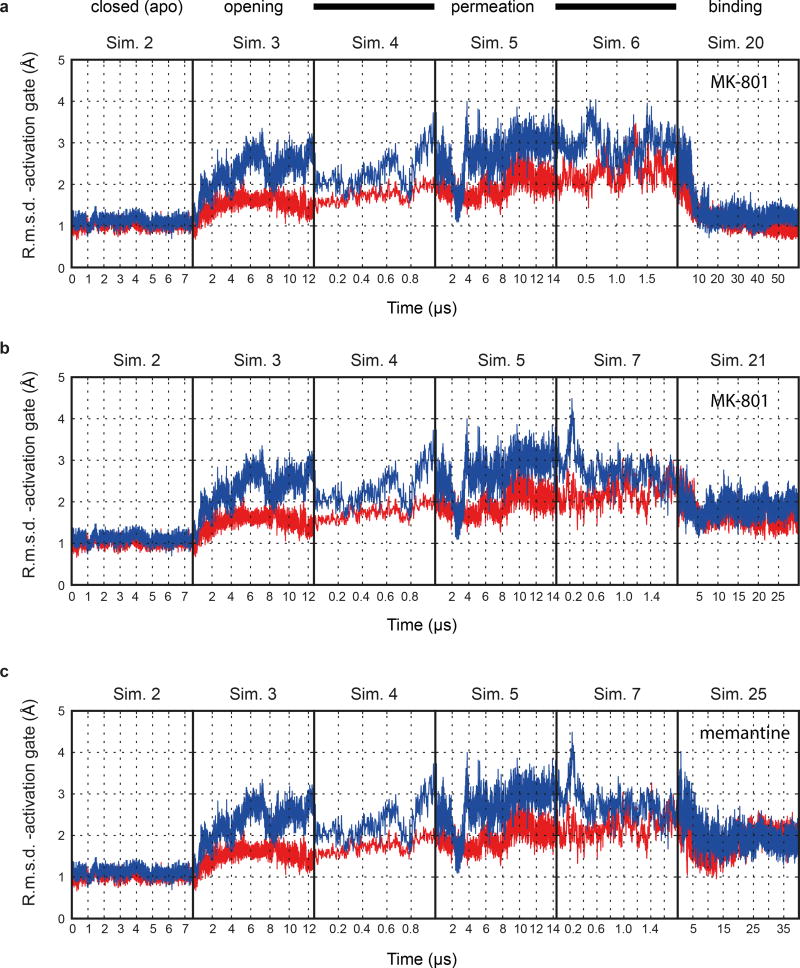
Extended Data Figure 6. Blocker-induced channel closure.
The resemblance between the closed, deactivated receptor (leftmost panels) and the closed, pore-blocked receptor (rightmost panels) is shown. a-c, R.m.s.d. (Å; GluN1, red; GluN2B, blue) of the M3 bundle–crossing region (i.e., the activation gate) relative to the closed-state ∆2 crystal structure obtained from simulations of the closed pore (Sim. 2), pore opening (Sim. 3), permeation (Sim. 4 at 396.6 ± 2.7 mV, Sim. 5 at 593.8 ± 3.8 mV, and Sim. 6 (a) at 396.1 ± 2.7 mV or Sim. 7 (b, andc) at 415.1 ± 6.4 mV), two MK-801 binding simulations (Sims. 20 (a) and 21 (b)), and one memantine binding simulation (Sim. 25 (c)). N=1 in each panel.

