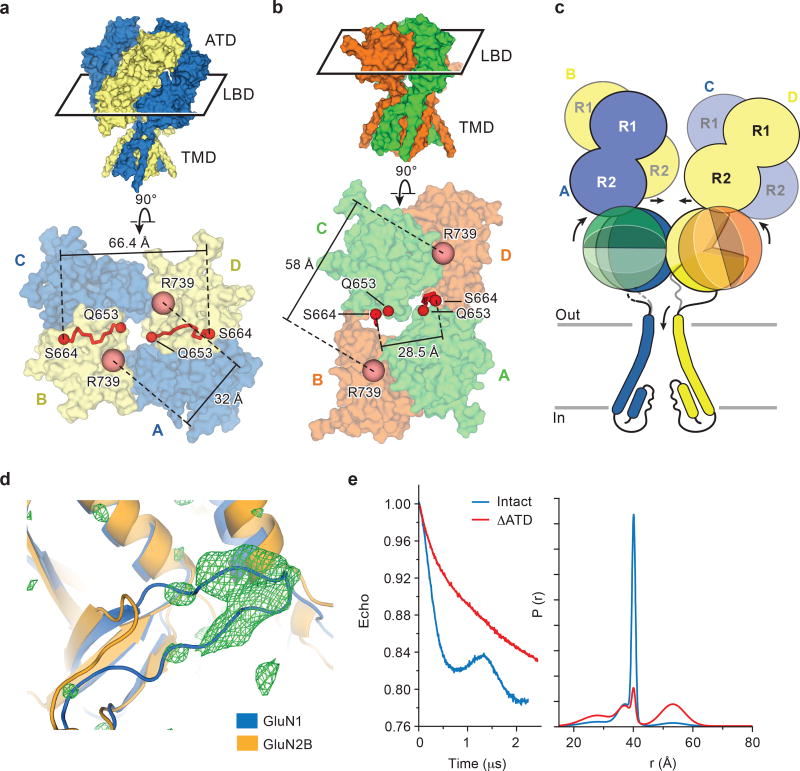
Extended Data Figure 2. LBD dimer rearrangement and dynamics.
a-b, Top down view from the extracellular side of the membrane, showing the LBD layer of the intact ∆2 NMDA receptor (a) with GluN1 in blue and GluN2B in yellow, and of the ∆ATD NMDA receptor (b) with GluN1 in green and GluN2B in orange. The M3-LBD linkers of GluN2B (red ribbon, Q653-S664) adopt distinct conformations in the two receptors. Shown are distances between GluN2B R739 residues (β carbon atoms; salmon spheres), the residue selected for the DEER experiments (in Å) in both the intact and ∆ATD receptors. c, Cartoon emphasizing how the ATDs participate in defining the conformation of the LBD layer and how this, in turn, keeps the GluN2B M3-D2 linker in a conformation capable of opening the channel gate. d, The Fo-Fc density (3σ, green mesh) fits loop 1 of the GluN1 subunit (blue cartoon) but not of the GluN2B subunit (orange cartoon). e, DEER data of MTSSL-labeled GluN2B R739C ∆ATD (red) (sample size n=2) and intact NMDA receptor (blue) (sample size n=1). Peak-normalized echo decay and the fits are shown on the left, and probability distributions of DEER distances are shown on the right. The probability distributions of the DEER distances show two major peaks, one centered at 35–40 Å and a second broad peak at ~55 Å. The amplitude of the two peaks in the ∆ATD receptor are comparable, with the 55 Å peak corresponding to the ‘rearranged’ LBD layer as seen in the ∆ATD crystal structure, whereas the shorter distance (~35–40 Å) indicates the canonical LBD arrangement, like that observed in the intact receptor structure. The intact receptor, by contrast, shows one major narrow peak at ~40 Å which corresponds nicely to the predicted distance based on the intact receptor crystal structure, whereas the small peak centered around 55 Å suggests the intact receptor may harbor a minor population with a ∆ATD-like LBD arrangement.

