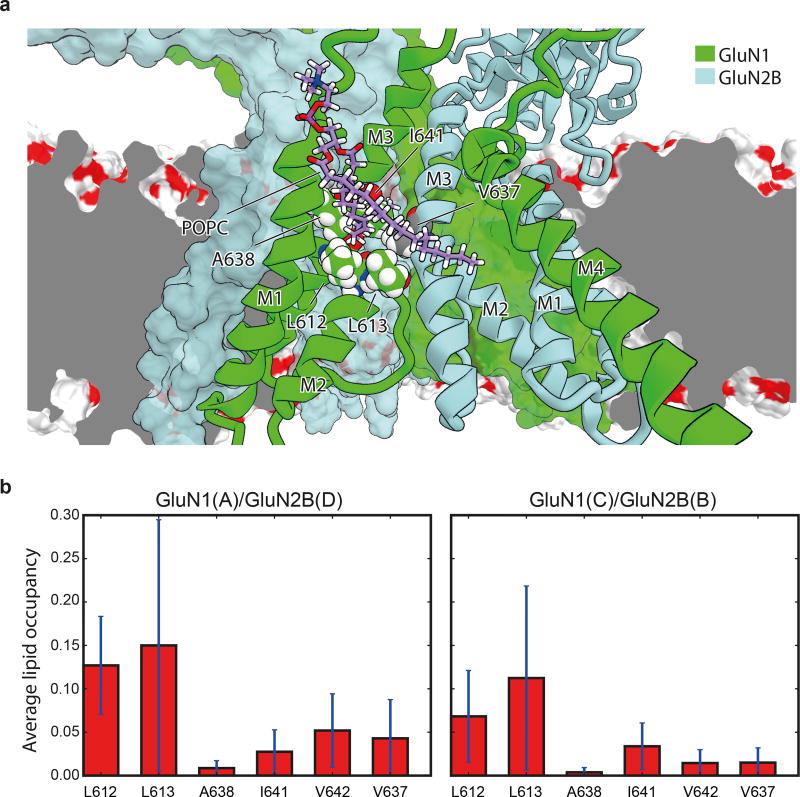
Extended Data Figure 4. Lipid accessibility of the TMD “tunnel”.
a, Simulation snapshot (Sim. 2) of a lipid molecule with one of its tails trapped between the M2 and M3 helices of the GluN1 subunit (chain A, green ribbons) and the M3 helix of the adjacent GluN2B subunit (light blue ribbons) viewed from within the membrane and toward the pore. Residues L612, L613, A638, I641, and V642 of GluN1 (chain A) and V637 of GluN2B (chain D) of the tunnel walls (see main text) are shown as spheres with the carbon atoms being colored green and gray, respectively. GluN1 (chain C) and GluN2B (chain B) subunits are shown as green and light blue solid surfaces. The dark gray plane represents a cut across the lipid membrane, the remainder of which is shown as a red-white surface. b, Average lipid occupancy (number of lipid atoms) within 3.5 Å of the tunnel “walls,” defined by residues L612, L613, A638, I641, and V642 of GluN1 (chains A, C) and residue V637 of the GluN2B (chains B, D) subunit lining. The occupancy was calculated across the closed-pore and pore-opening simulations (Sims. 2 and 3) and all permeation simulations (Sims. 4–17). All individual simulations within a given panel = N; all individual data points aggregated across all simulations = n. N=16 (Sim. 2, 3, 4–17); n>>10. The error bars are standard deviations of the mean calculated from all individual data points aggregated across all simulations.

