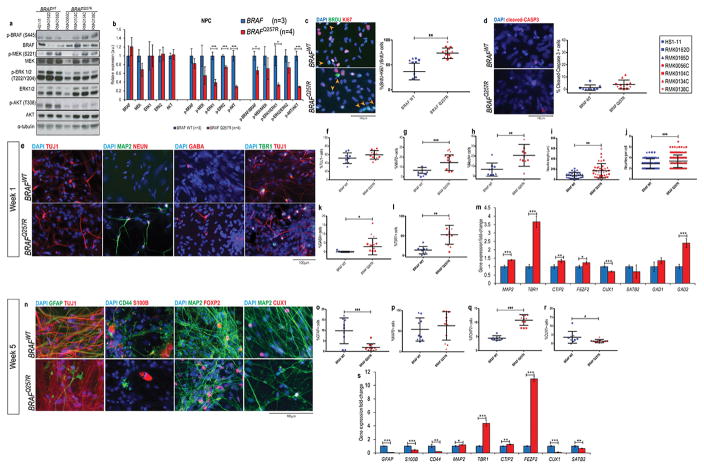
Figure 1. CFC neural cultures show progenitor pool depletion, early maturation, and imbalance of neural cell types.
(A) Western blot analysis of the components of the Ras/MAPK pathway and its phosphorylation status, and quantification of the blots (B) from protein lysates extracted from CFC and control NPC cultures. The results were normalized with their corresponding α-tubulin values (assigned a value of 1) and are mean ±SD of two independent experiments (C) Double immunostaining for BrdU (green) and Ki67 (red) of early neuronal progenitors within 48h of differentiation; progenitors that exited the cell cycle, %(BrdU+Ki67−)/BrDU+ cells (orange arrows) were quantified. (D) Cleaved caspase 3 staining for cell death of the same NPCs and subsequent quantification. (E) Immunostaining of TUJ1, MAP2, NEUN, GABA, and TBR1 of CFC lines and control lines at week 1 of neural differentiation. Quantification of these stainings are shown as percentage of TUJ1+ cells (F), MAP2+ cells (G), NEUN+ cells (H), average neurite length of TUJ1+ cells (I), average number of neurites per TUJ1+ cell (J), percentage of GABA+ cells (K), and TBR1+ cells (L). (M) mRNA levels of MAP2, deep layer markers TBR1, CTIP2, and FEZF2, upper layer markers CUX1 and SATB2, and GABA precursors GAD1 and GAD2 in one-week old neural cultures. ΔCt values were calculated by normalizing the average Ct value of each cell line by the average Ct value of GUSB of the same cell line; ΔΔCt was calculated by normalizing the ΔCt value of each line to the average ΔCt value of the control lines. (N) Immunostaining of TUJ1, GFAP, CD44, S100, MAP2, FOXP2, and CUX1 at week 5 of neural differentiation. Quantification of these stainings is shown as a percentage of cells expressing GFAP (O), MAP2 (P), FOXP2 (Q) and CUX1 (R). (S) mRNA level analysis of astroglial cell markers GFAP, S100B, CD44, neuronal marker MAP2, deep layer markers TBR1, CTIP2, and FEZF2, upper layer markers CUX1 and SATB2 in five-week old neural cultures. ΔCt values were calculated by normalizing the average Ct value of each cell lines by the average Ct value of GUSB of the same cell line; ΔΔCt was calculated by normalizing the ΔCt value of each line to the average ΔCt value of the control lines. For all immunostainings depicted, at least three fields per coverslip from three independent experiments were counted. For all scatter plots illustrated, values represent mean±SD per condition, calculated with repeated measures ANOVA, accounting for biological and technical replicate values. Number of subclones and independent experiments performed are detailed in Supplementary Table 3. Values for mean and standard deviation of each control and CFC subject for each experiment are detailed in Supplementary Table 7. p≤0.05 (*), p≤0.01 (**), p≤0.001 (***).

