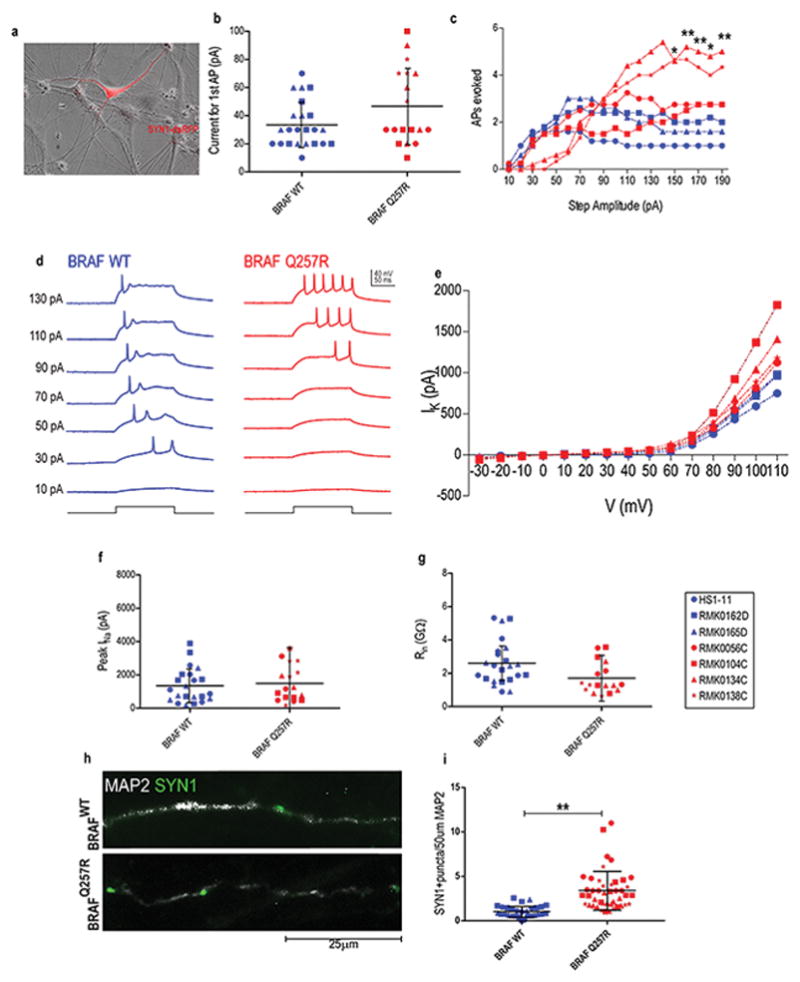
Figure 2. Increased intrinsic excitability in CFC-derived neurons.

(A) Overlaid dsRFP fluorescence and phase-contrast images depicting a SYN1−DsRFP+ neuron. For the patch clamp experiments (B–G), we performed two independent blind experiments, with one subclone per cell line. (B) The average current per individual required to elicit a single AP in neurons from control-derived neurons (blue), CFC-derived neurons (red). (C) The quantified AP response evoked by step currents of increasing amplitude. (D) Example current-clamp recordings from control-derived and CFC-derived neurons. Additional measures of intrinsic excitability: IK (E), Peak INa (F), Rin (G). (H) Immunostaining of Synapsin1+ puncta on MAP2+ control- and CFC-derived neurons at week 5 of differentiation. (I) Quantification of Synapsin1+ puncta per 50 μm neurite length in control- and CFC-derived neurons. For all immunostainings depicted, at least ten MAP2+ neurons per coverslip from three independent experiments were counted. For all scatter plots illustrated, values represent mean±SD per condition, with significance calculated using repeated measures ANOVA, accounting for biological and technical replicates. Number of subclones and independent experiments performed are detailed in Supplementary Table 3. Values for mean and standard deviation of each control and CFC subject for each experiment are detailed in Supplementary Table 7. p≤0.05 (*), p≤0.01 (**), p≤0.001 (***).
