Figure 1.
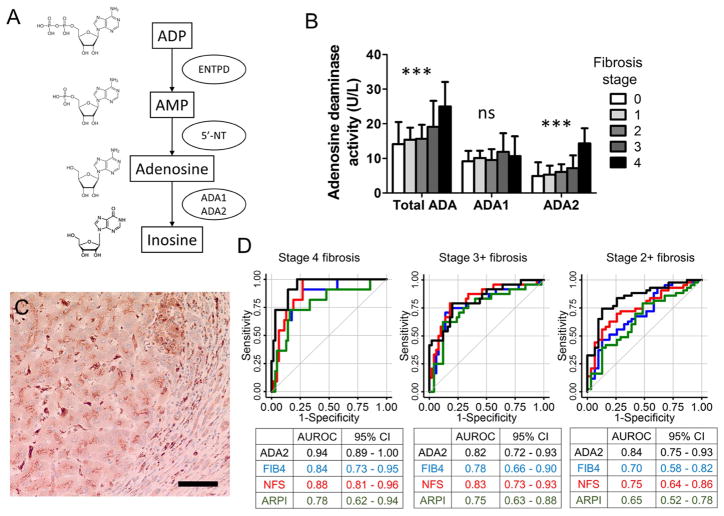
A. A schematic diagram of extracellular ADP metabolism shows the three enzymatic steps measured in this study. B. The serum activity of ADA2 increases with the stage of liver fibrosis in NAFLD (***, p < 0.001). C. An immunohistochemistry of ADA2 in a liver biopsy with stage 4 fibrosis. Scale bar represents 50 μm. D. ROC analysis comparing the predictive value of serum ADA2 activity (black) for liver fibrosis with established fibrosis indices: FIB4 (blue), NFS (red) and APRI (Green).

