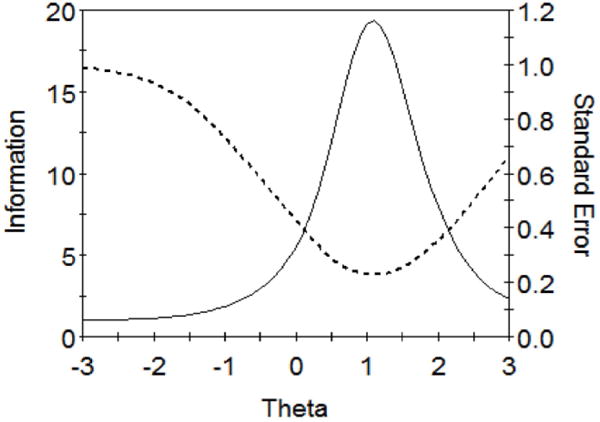
Figure 1.

Test information function (solid line) and standard error function (dashed line). The y-axis on the left indicates the amount of information (I), an index of how precisely the cannabis-related word association test estimates the latent trait at a given level of theta. The y-axis on the right shows standard error, which is the inverse of the square root of test information. The x-axis represents the level of theta, or the latent cannabis-related associative memory, with 0 representing the mean level of theta.
