Figure 1.

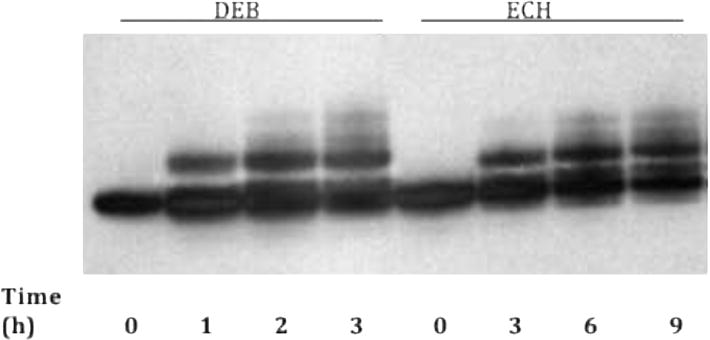
Representative time course of monoalkylation reactions with Duplex A. Shown here are the results for DEB (250 mM) and ECH (250 mM). Presumed monoadducts appear as bands with lower mobility than the zero time point band.

Representative time course of monoalkylation reactions with Duplex A. Shown here are the results for DEB (250 mM) and ECH (250 mM). Presumed monoadducts appear as bands with lower mobility than the zero time point band.