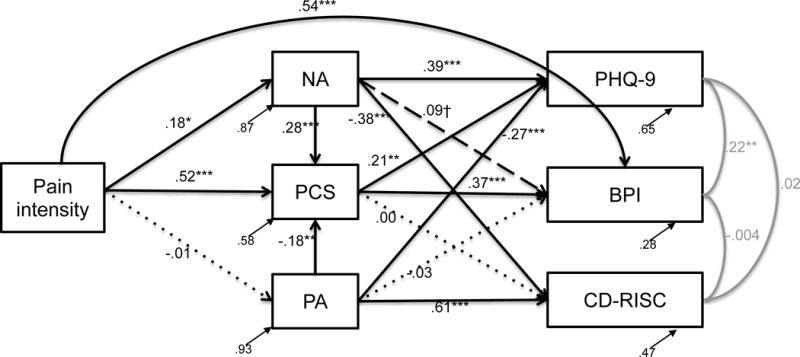
Figure 1.

Pain model with standardized parameter estimates and residuals, χ2(31) = 19.66, p = .018, RMSEA = .061, CFI = .965, SRMR = .060. Black solid lines denote significant pathways, black dashed lines denote marginally significant paths, and black dotted lines denote nonsignificant paths. Gray lines signify associations between the outcome variables. †p<.10, *p<.05, **p<.01, ***p<.001; PCS = Pain Catastrophizing Scale; NA = negative affect; PA = positive affect; BPI = Body Pain Inventory pain interference; PHQ-9 = Patient Health Questionnaire-9 depression scale; CD-RISC = Connor Davidson Resilience scale
