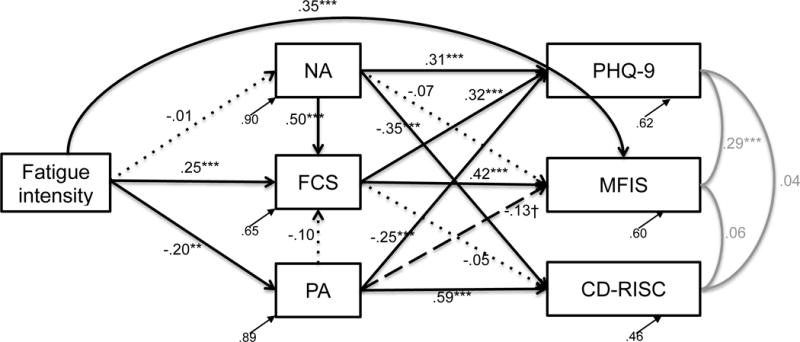
Figure 2.

Fatigue model with standardized parameter estimates and residuals, χ2(27) = 59.97, p = .0003, RMSEA = .087, CFI = .925, SRMR = .066. Black solid lines denote significant pathways, black dashed lines denote marginally significant paths, and black dotted lines denote nonsignificant paths. Gray lines signify associations between the outcome variables. †p<.10, *p<.05, **p<.01, ***p<.001; FCS = fatigue catastrophizing; NA = negative affect; PA = positive affect; MFIS = Modified Fatigue Impact Scale; PHQ-9 = Patient Health Questionnaire-9 depression scale; CD-RISC = Connor Davidson Resilience scale
