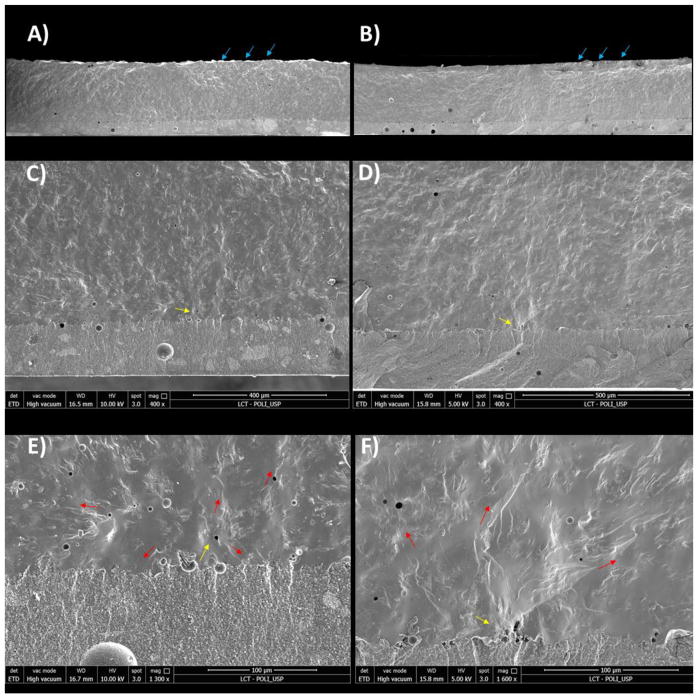
Figure 3.
SEM images of fracture surfaces. Figures ‘A’, ‘C’ and ‘E’ represent the control group; figures ‘B’, ‘D’ and ‘F’ represent a sample of porcelain bonded to a RC formulated with oligomer P_AL. Blue arrows (in Figures ‘A’ and ‘B’) indicate the compression curl; yellow arrows (Figures ‘C’-‘F’) indicate the fracture origin; red arrows (in Figures ‘E’ and ‘F’) indicate wake hackles.

