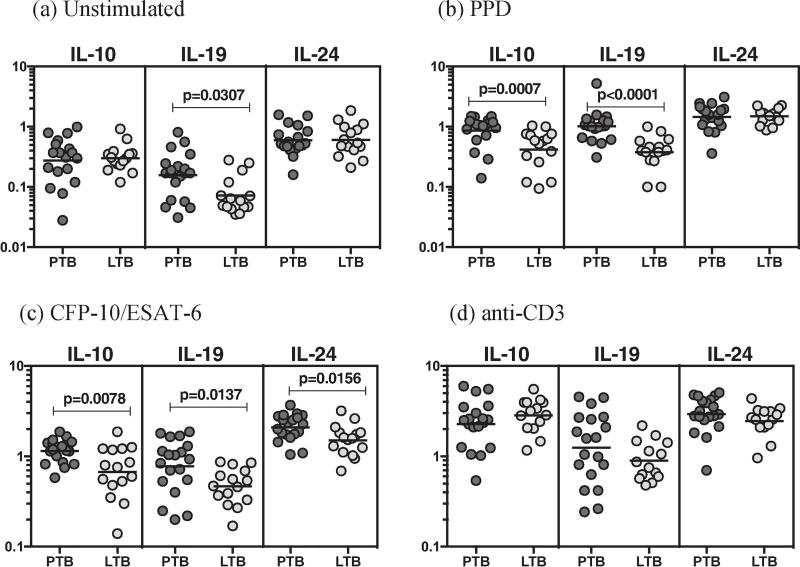
Figure 1.
PTB is associated with increased antigen-induced frequency of CD4+ T cells expressing IL-10, IL-19 and IL-24. Whole blood from PTB (n=20) and LTB (n=20) individuals was stimulated with PPD, CFP-10+ESAT-6, and anti-CD3 for 24 h, and the frequencies of IL-20 subfamily of cytokines in PTB and LTB individuals (A) at baseline as well as in response to stimulation with (B) PPD, (C) CFP-10+ESAT-6, (D) anti-CD3 were estimated by flow cytometry. Stimulated frequencies are shown as scatter plots with the line representing the geometric means. Frequencies following stimulation with antigens are depicted as net frequencies (with baseline values subtracted). P values were calculated using the Mann–Whitney U test.

