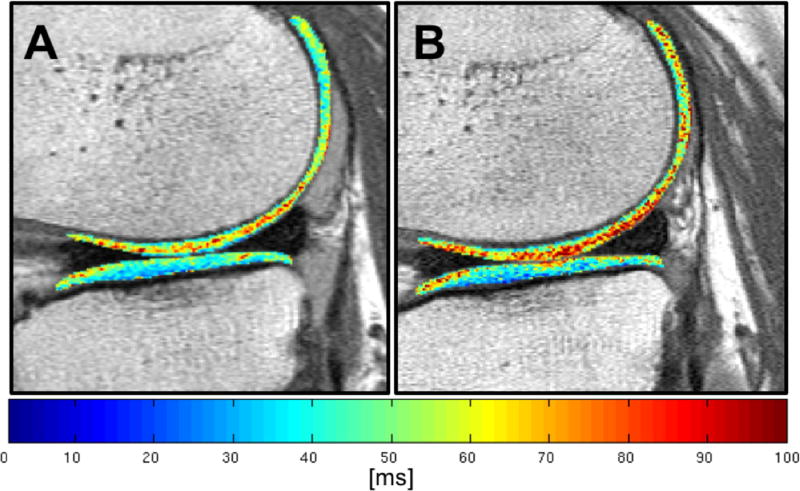
Figure 2. Longitudinal change of T2 color map of a diabetic patient over 24-months.
T2 color maps of the same diabetic patient at baseline (A) and after 24-months (B), both showing the region of the lateral femoral condyle and the lateral tibial plateau. At baseline (A), the tibial plateau shows predominantly lower T2 values (blue and green), whereas, especially the weight-bearing portion of the lateral condyle already shows areas of higher T2 values (yellow and red). After 24-months (B) the cartilage of the femoral condyle shows overall increased T2 values, including the posterior aspect of the femoral condyle. The tibial plateau also shows several areas of higher T2 values, with particular emphasis at the anterior and posterior aspect of the tibial plateau, consistent with an accelerated rate of cartilage matrix degradation.

