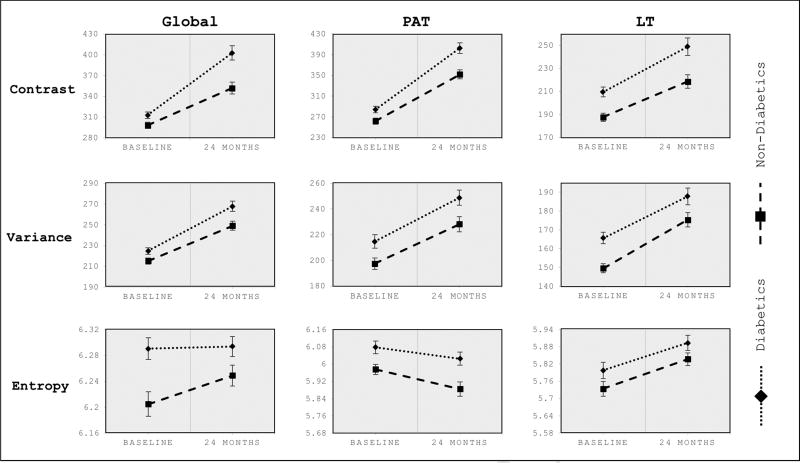
Figure 4. Cross-sectional GLCM texture analysis in diabetics and non-diabetics at baseline and 24-months.
Texture parameters (contrast, variance, and entropy) in diabetics and non-diabetics at baseline and 24-months. Data are given as adjusted means, corrected for age, sex, baseline BMI and baseline KL score. Error bars indicate standard errors. P-values in bold refer to significance of differences between diabetics vs non-diabetics at baseline and 24-months, respectively: Global knee contrast (p=0.021, baseline; p<0.001, 24-months), patella contrast (p=0.010, baseline; p=0.001, 24-months), lateral tibia contrast (p<0.001, baseline; p=0.004, 24-months). Global knee variance (p=0.029, baseline; p=0.007, 24-months), patella variance (p=0.009, baseline; p=0.009, 24-months), lateral tibia variance (p<0.001, baseline; p=0.041, 24-months). Global knee entropy (p=0.001, baseline; p=0.058, 24-months), patella entropy (p=0.009, baseline; p=0.002, 24-months), lateral tibia entropy (p=0.144, baseline; p=0.121, 24-months). Global = global T2 values/mean of all compartments, PAT = patella, LT, lateral tibia.

