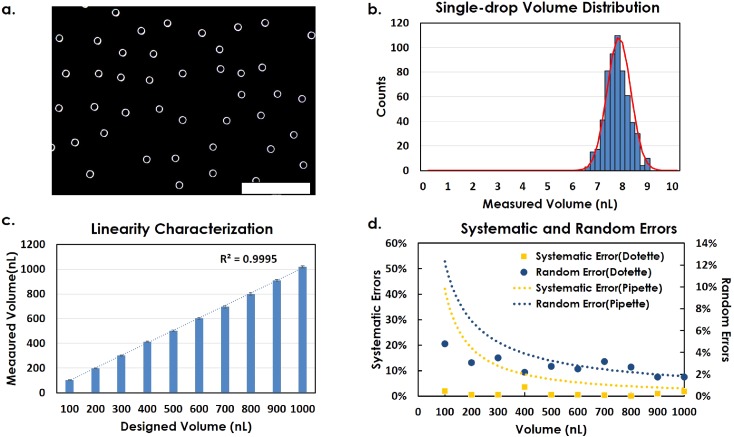
FIG. 4.
(a) Sample image of individual droplets printed into oil. Scale bar: 2 mm. (b) Single-drop volume distribution histogram characterized by an imaging method. (c) Linearity of accumulated droplets from 100 nl to 1000 nl, characterized by a gravitational method. (d) Decreasing trend of systematic error and random error with the increasing volume range, calculated from (c).

