Fig. 2.
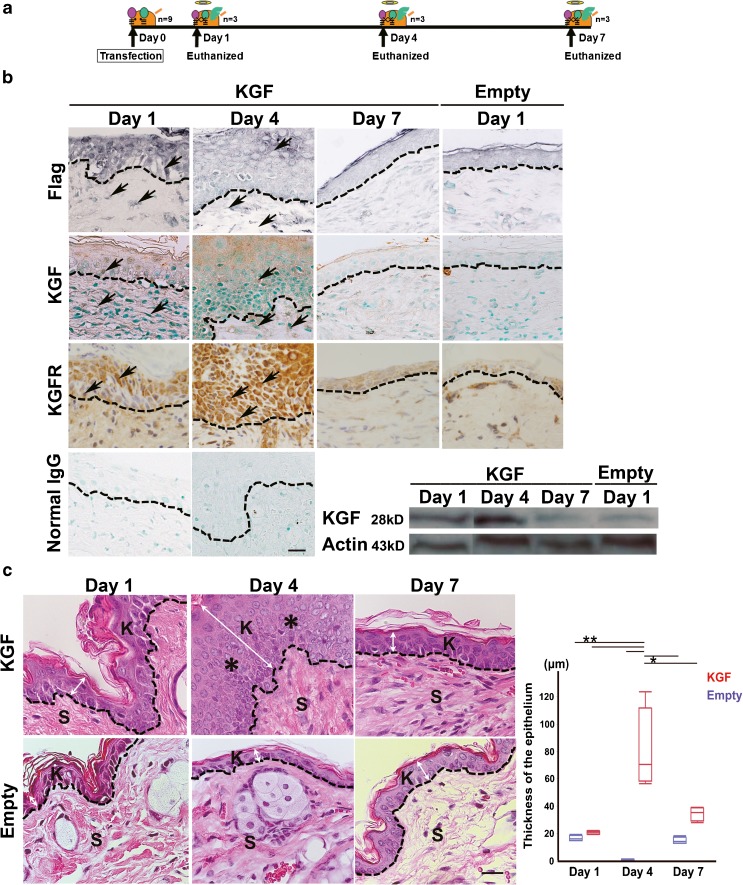
Morphological changes in the mouse epidermis after KGF gene transfection. a Schematic description of the method for electroporated transfection of KGF vector in mouse ear skin. The animals were euthanized using an intraperitoneal injection of 200 mg/kg pentobarbital and their ear skin tissue was removed 1, 4, and 7 days after vector transfection. b Immunohistochemical analysis using the anti-FLAG M2 and KGF antibody in sections of KGF gene-transfected ear skin tissue (KGF) (day 1, day 4, and day 7) and the vector alone-transfected ears (Empty) (day 1). Intense staining for FLAG and KGF was detected abundantly in epithelial cells and in some stromal cells of KGF gene-transfected ear skin tissue at day 1 and day 4. FLAG-hKGF expression vector was successfully transfected in vivo and induced KGF expression until day 4. KGFR expression was detected until day 4. No staining of Flag, KGF, and KGFR was observed in the vector alone-transfected ears. No staining was observed with normal mouse IgG and rabbit IgG instead of first antibody. The results of a Western blot analysis of KGF in transfected tissue. KGF: lysate of the skin of the hKGF gene-transfected ears. Empty: lysate of skin of the vector alone-transfected ears. Each lysate was obtained after vector transfection at day 1, day 4, and day 7. The total applied volume was 50 μg per lane. Each lane was reacted with 0.2 μg/ml anti-KGF antibody. An intense band was detected in the hKGF-transfected ears at day 4. c H&E staining of mouse ear skin tissue after vector transfection. KGF gene-transfected ear (KGF) (upper panels, day 1, day 4, and day 7). Vector alone-transfected ear (Empty) (lower panels, day 1, day 4, and day 7). Single transfection of KGF-induced keratin accumulation and thickened squamous epithelium (asterisk) of ear skin tissue at day 4. Dashed lines indicate the basement membrane. K indicates keratinizing squamous epithelium. S indicates the subepithelial region. Scale bar, 20 μm. Arrows indicate positive cells. Double arrow indicates the thickness of the epithelium. Scale bars, 20 μm. Box plot showing the thickness of the epithelium (μm) in vector alone-transfected ear skin (blue boxes) and KGF gene-transfected ears (red boxes). (*p < 0.001, **p < 0.0001 as determined by a two-way ANOVA F(5, 18) = 19.74 with a Tukey’s post hoc test)

