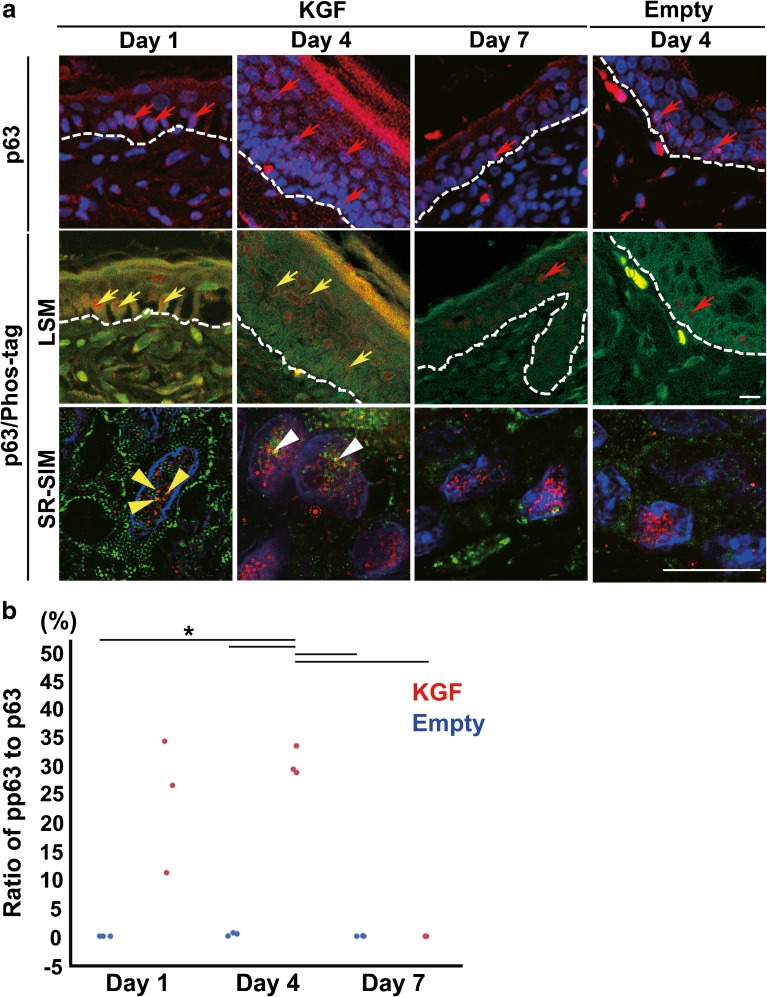
Fig. 4.
KGF gene transfection activated the phosphorylation level of p63 in epithelial cells. a Immunofluorescence detection of p63 (red) in the section of KGF gene-transfected (KGF, day 1, day 4, and day 7) and vector alone-transfected mouse ear skin tissue (Empty, day 4) (upper panels). DAPI (4′, 6′- diamidino-2-phenylindole) was used to stain the nuclei (blue). The expression of p63 (red arrows), a reliable stem cell marker of stratified epithelia, was detected in many basal cells and in some upper basal cells at day 1 and in many upper basal cells at day 4 after KGF gene transfection. Double immunofluorescence detection of p63 and Phos-tag in the section of KGF gene-transfected (day 1, day 4, and day 7) (middle panels) and vector alone-transfected (day 4) mouse ear skin tissue (middle panels). Merged LSM images and SR-SIM images show p63 (red) and Phos-tag (green) and nuclei stained with DAPI (blue). In KGF gene-transfected ear skin tissue, high pp63 expression (yellow arrows) within the nuclei was detected in the basal and upper layers at day 1 and in the upper layer at day 4. SR-SIM images (lower panels) show three yellow dots depicting the pp63 (yellow arrow heads) detected in the nuclei of p63-positive basal cells at day 1 and pp63 spots (white arrow heads) in upper-layer cells at day 4 after KGF gene transfection. Dashed lines: basement membrane. Scale bars, 10 μm. b Dots plot showing the ratio of pp63/p63 in a nuclear of the epithelium in vector alone-transfected ear skin (n = 3 for each) (blue dots) and KGF gene-transfected ear (n = 3 for each) (red dots). (*p < 0.0001 as determined by a two-way ANOVA F(5, 12) = 24.96, with a Tukey’s post hoc test)

