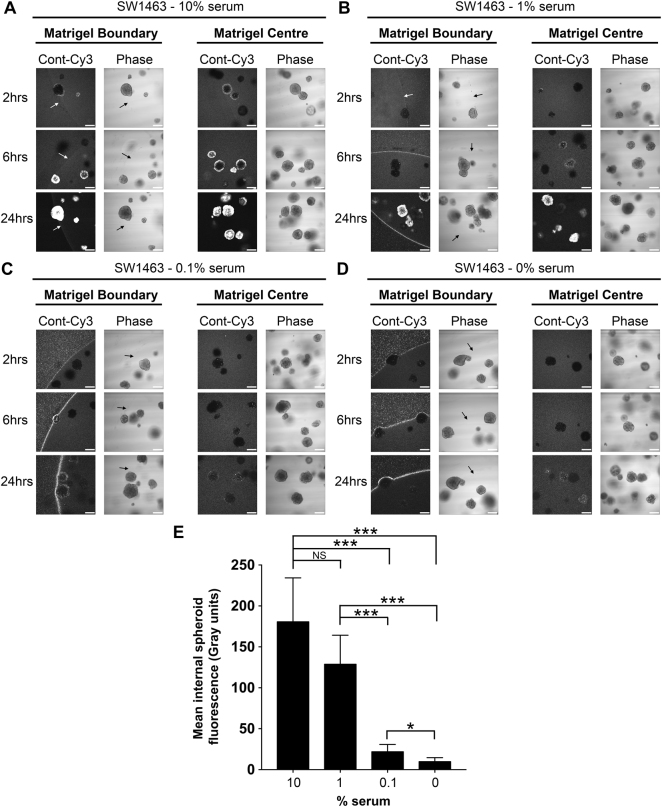
Figure 5.
Optimal siRNA uptake by matrigel and spheroids occurs with a 1–10% serum concentration. Representative confocal images of SW1463 spheroids showing localization of control-Cy3 siRNA at 2, 6 and 24 hours post transfection with siRNA formed with (A) 10% (B) 1% (C) 0.1% or (D) 0% serum using RNAiMax. (E) Summary graph showing the mean internal spheroid fluorescence post transfection using siRNA formed with a dose-response of serum. Data represents mean ± 1 s.d (n = 3). Statistical significance is denoted by *P < 0.05 and ***P < 0.0001 (NS = not significant) as analyzed by a paired student’s t-test.

