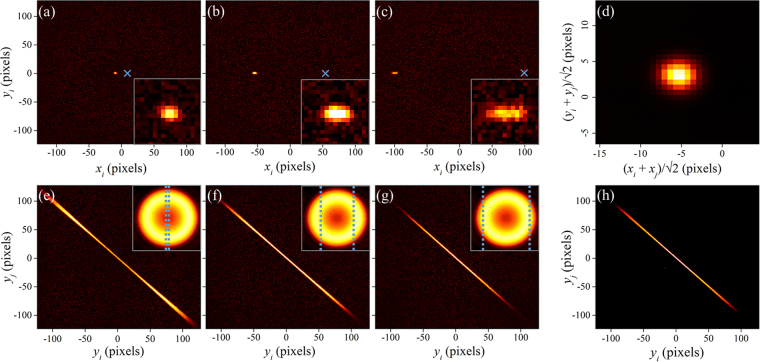
Figure 2.
Information contained in the full 4D measurement of biphoton joint probability distribution. (a–c) Variation of at different distances from the center, indicated by blue ×, showing anti-correlation of width that increases with |x| (see insets). (d) Projection of onto sum coordinates averages the variations in (a–c). (e–g) 2D slices of for fixed (indicated by blue dashed lines in inset of 〈〉) showing variation in anti-correlation with horizontal separation. (h) Projection of onto (integration over and ) averages the structures in (e–g), giving only a mean profile.

