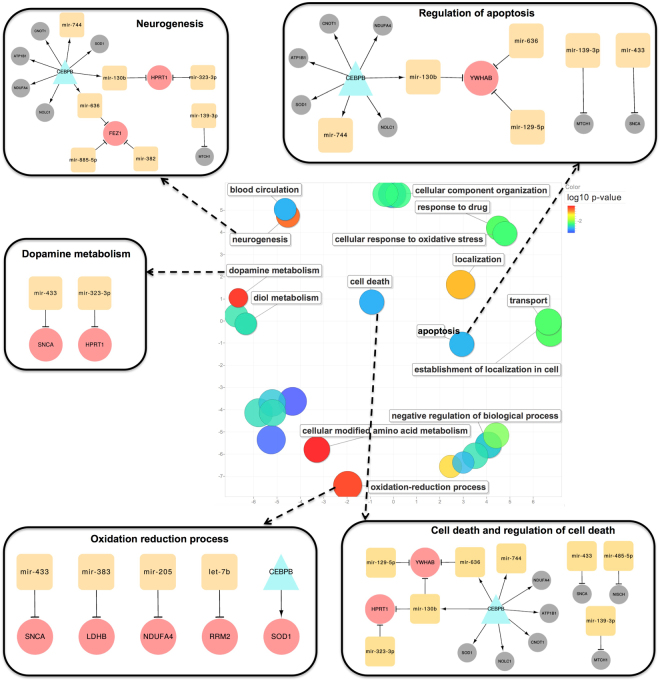
Figure 4.
Enrichment analysis of the PD-GRN genes and visualization of five network modules corresponding to PD-related GO terms. Five GO terms are often affected in PD cases. The total list of the enriched GO terms is found in Table S2. The central scatter plot shows the visualization of the top enriched generic GO terms of the PD-GRN in a two dimensional space based on the GO semantic similarities. GO term node colours indicate the p-values for the enrichment of the GO terms. These generic GO terms represent implicitly their subterms, which are not visualized in the plot. The scatter plot was generated using the web tool REVIGO79. All five network modules include both miRNAs and genes. The main TF CEBPB is highlighted by a cyan triangle while the miRNAs are represented by orange squares. The genes co-targeted by TFs and/or miRNAs are depicted in larger pink circles. The regulated genes, regulated by a TF or by a miRNA, are coloured in grey. The network modules were visualized using the Cytoscape tool.

