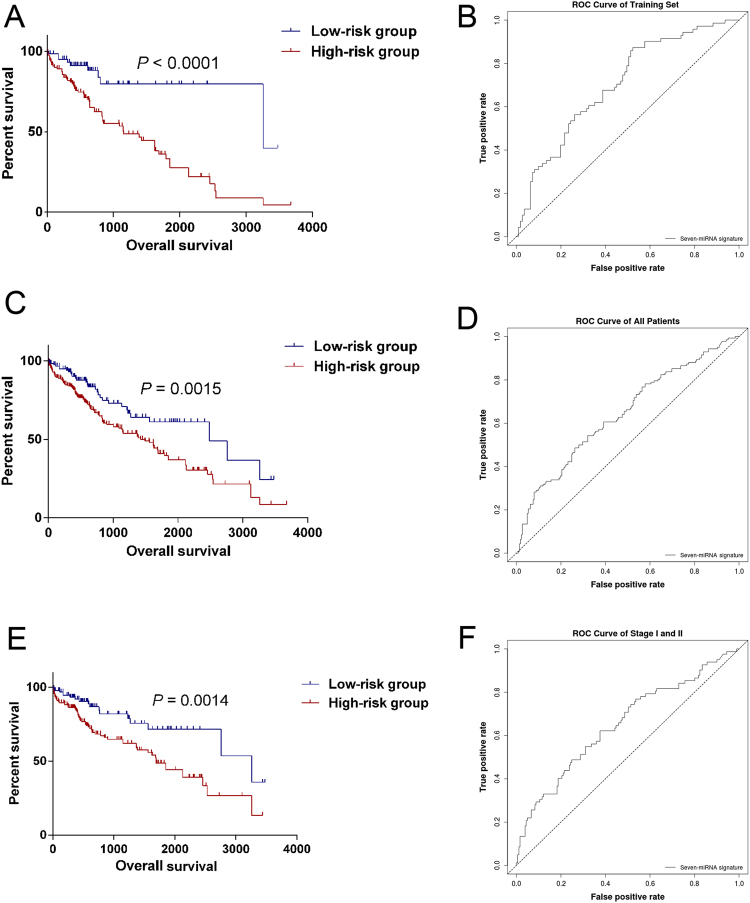
Figure 2.
Kaplan–Meier and ROC curves for the seven-miRNA signature in LIHC patients. The Kaplan–Meier curves for training set (A), entire LIHC cohort (C) and in early stages (E) divided by the optimum cutoff point. Patients with high scores had the poor outcome in terms of OS (Median OS of testing set: 3258 days vs. 1153 days, P < 0.0001; Median OS of entire LIHC cohort: 2486 days vs. 1490 days, P = 0.0015; Median OS of entire LIHC cohort: 3258 days vs. 1294 days, P = 0.0014). The ROC curve for predicting 60-month survival for training set (B), entire LIHC cohort (D) and patients in early stages.

