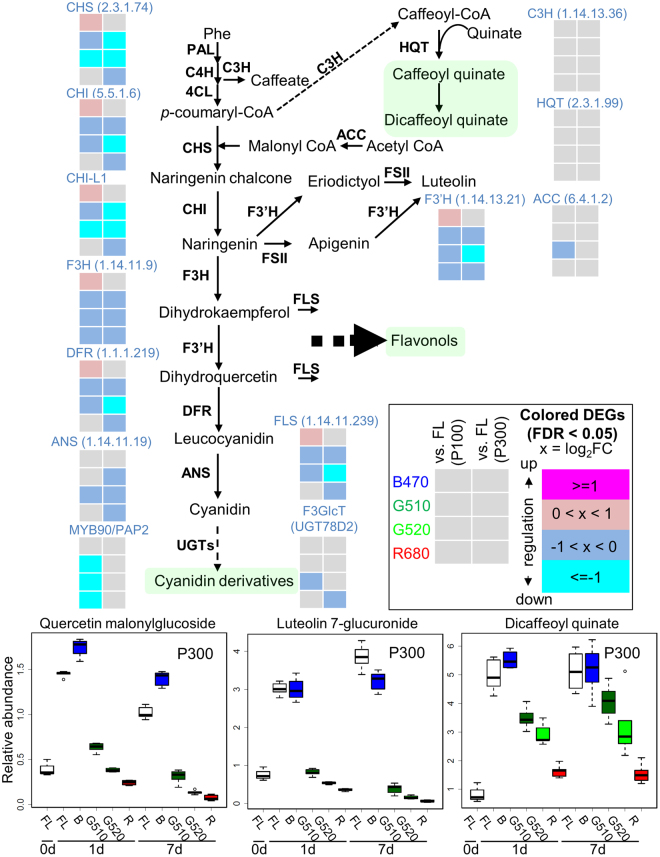
Figure 6.
Integrated pathway analysis of metabolome and transcriptome data obtained under different light qualities. The biosynthetic pathways and expression profiles of genes involved in the biosynthesis of phenylpropanoid and flavonoid skeletons are displayed. Fold changes (e.g., G510 vs. FL) in expression levels of genes encoding enzymes involved in the phenylpropanoid biosynthetic pathway are shown. ACC, acetyl-CoA carboxylase; C4H, cinnamate 4‐hydroxylase; 4CL, 4‐hydroxycinnamoyl CoA ligase; F3′H, flavonoid 3′-hydroxylase; FSII, flavone synthase II; FLS, flavonol synthase; F3GlcT, UGT78D2; C3H, Coumarate-3-hydroxylase; HQT, hydroxycinnamoyl CoA quinate transferase; and FL, white fluorescent light.

