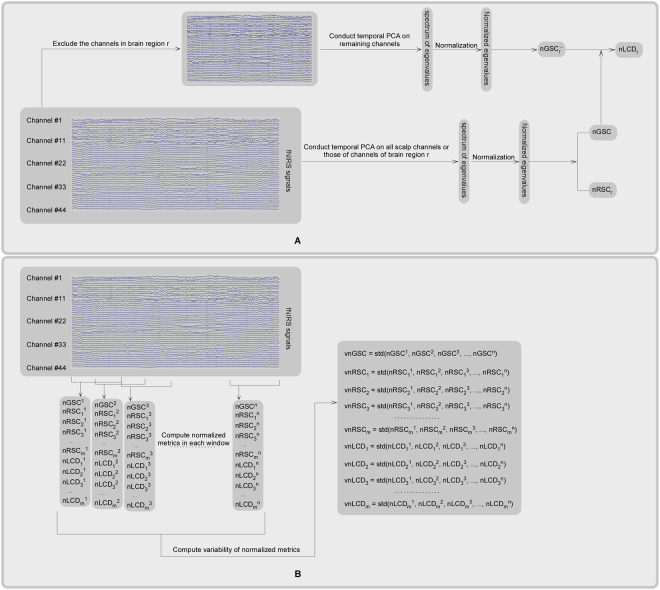
Figure 5.
The procedure of time-averaged normalized spatial complexity metrics computation (panel A) and variability of normalized spatial complexity metrics computation (panel B). Panel A: In order to compute time-averaged nGSC and nRSC of region r (i.e., nRSCr), temporal PCA was conducted on the fNIRS signals of all scalp channels and those of region r respectively, which resulted in spectrum of eigenvalues. Then these eigenvalues were normalized to unit sum (see Equation [1]). Lastly, the nGSC or nRSCr was computed using the Equation (2). During the computation of nLCD of region r (i.e., nLCDr), the normalized global spatial complexity when excluding the channels in region r from the analysis (i.e., nGSCr−) was computed firstly. Then the nLCDr was computed as the difference between nGSC and nGSCr− (see Equation [3]). Panel B: Firstly, the entire fNIRS signal was divided into a dozen of overlapping time windows. Then, the nGSC, the nRSC and nLCD of each brain region within each time window were computed using the procedure illustrated in the panel A. Lastly, the standard deviations of these normalized spatial complexity metrics across these time windows were computed, which were used as metrics that quantify the vnGSC, the vnRSC and the vnLCD of each brain region. In this panel, m and n denoted the number of brain regions (6 in this case) and the number of time windows respectively. Note that, although this procedure was initially designed for fNIRS signals, it could be easily applied to other kinds of brain signals (e.g., EEG, MEG, and fMRI).

