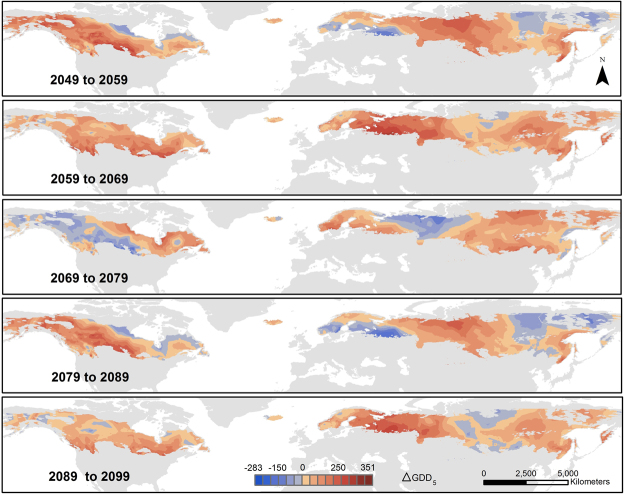
Figure 2.
Spatial and temporal variability of GDD5 changes within the boreal region as described by selected 10-year period projections. Each map displays the difference between the respective five-year period average values (e.g. 2049 stands for the period 2045–2049). The values were obtained by averaging the emission CO2 based projections for the seven GCMs. More detailed steps can be found in the Extended Data (Fig. 7). Map created using ArcGIS Desktop v. 10.4.165.

