
Figure 4.
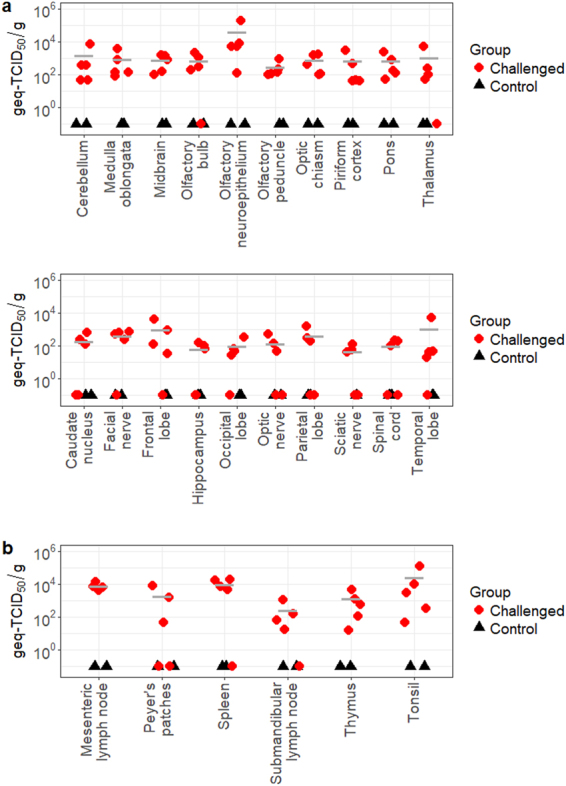
Viral load of CNS (a) and lymphoid (b) tissues collected at 3 DPI, as estimated by RT-qPCR. Geq-TCID50 = genome equivalent-50% tissue culture infectious dose. Bar lines indicate the mean of the values collected from the challenged animals.
Official websites use .gov
A
.gov website belongs to an official
government organization in the United States.
Secure .gov websites use HTTPS
A lock (
) or https:// means you've safely
connected to the .gov website. Share sensitive
information only on official, secure websites.
Viral load of CNS (a) and lymphoid (b) tissues collected at 3 DPI, as estimated by RT-qPCR. Geq-TCID50 = genome equivalent-50% tissue culture infectious dose. Bar lines indicate the mean of the values collected from the challenged animals.