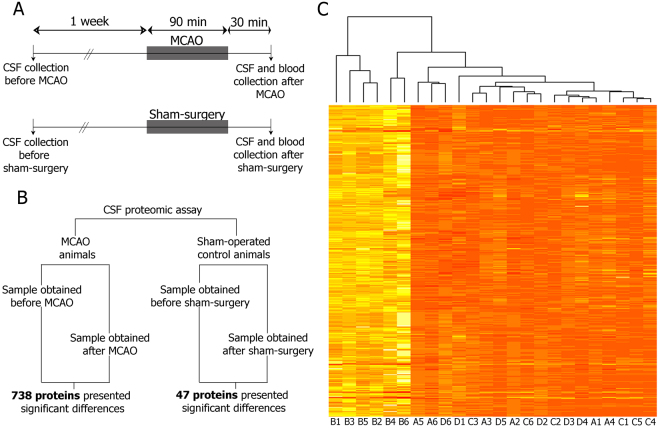
Figure 1.
(A) Schematic representation of the design of the experimental study. (B) Schematic representation of data analyzed by the SOMAscan proteomic assay. (C) Color map of relative fluorescence units (RFU) of the 738 proteins that were significantly altered after the ischemia. Squares are color coded; bright yellow color indicates high RFU and pale orange color indicate low RFU. The brighter the color is, the higher RFUs are. A1-A6 indicate samples obtained before MCAO; B1-B6 indicate samples obtained 2 h after MCAO; C1-C6 indicate samples obtained before sham surgery; D1-D6 indicate samples obtained after sham surgery. Abbreviations: CSF: cerebrospinal fluid; MCAO: middle cerebral artery occlusion.

