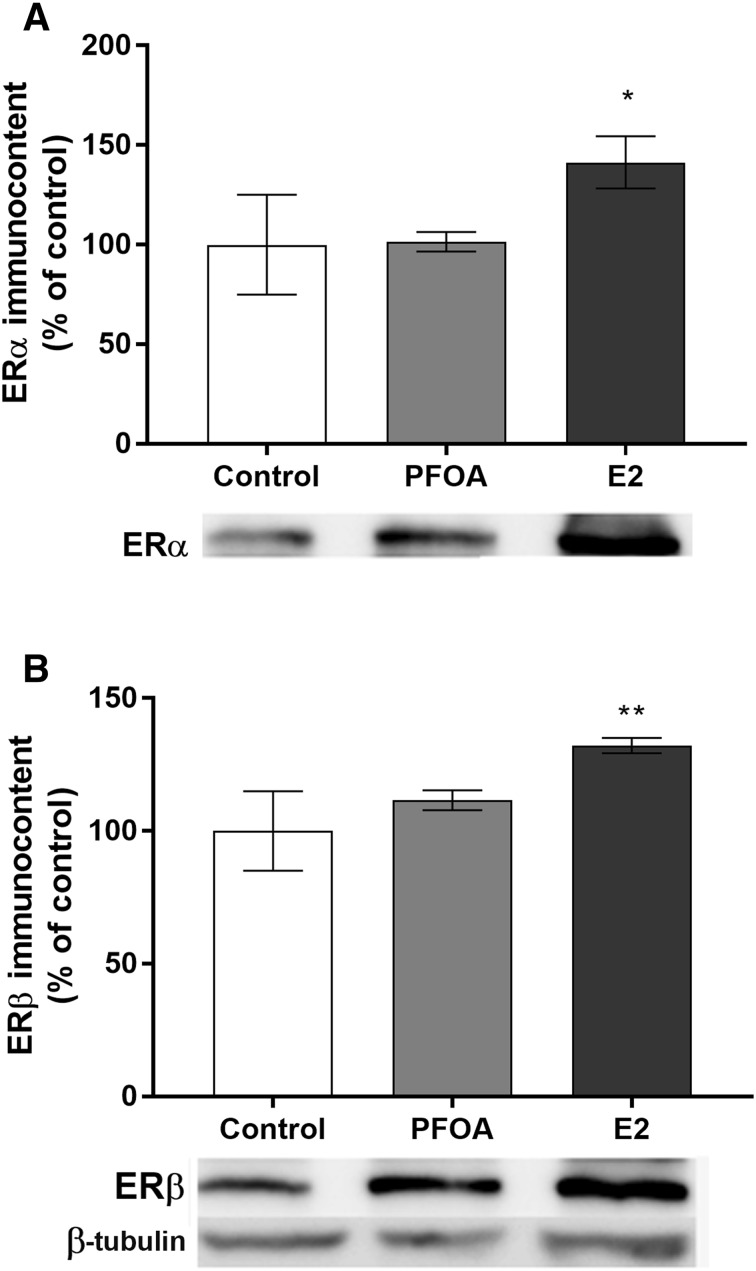
Fig. 4.
Effect of PFOA and 17β-estradiol (E2—positive control) on ERα (a) and ERβ (b) protein levels in MCF-10A breast cells. The cells were exposed to 100 µM PFOA or 10 nM E2 for 72 h. β-tubulin was used as a loading control. Representative blots of three experiments are shown. The results of densitometry analysis are expressed as ER protein band density normalized to the density of β-tubulin bands. Data are reported as mean ± SD of three independent experiments. Statistically significant differences from control are indicated as follows: **p < 0.01 and *p < 0.05 (one-way ANOVA followed by the Tukey–Kramer test)

