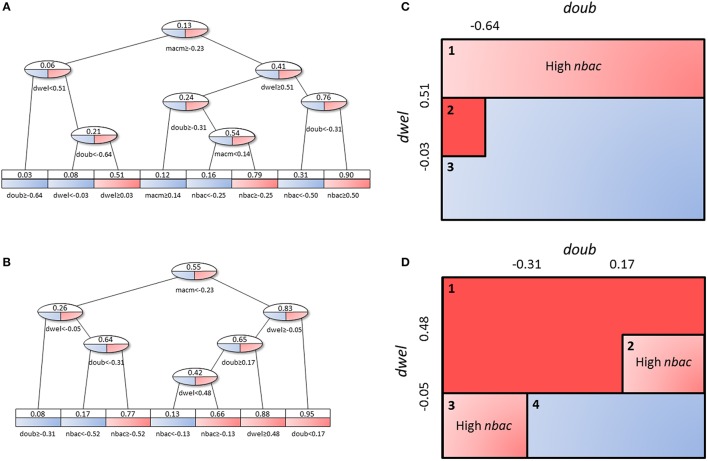
Figure 10.
Decision tree analysis on tissue-level parameter values in the combined low load and high load groups. Red represents a set of solutions whose average infectivity is equal to or higher than 0.5, while blue stands for infectivity lower than 0.5. The intermediate steps (ovals) show both colors, as they cannot be classified unanimously at this level. Solutions with high macrophage movement speed (A) are separated from those with low macrophage movement speed (B). The original tree can be seen in Figure S4. (C,D) represent an alternative depiction of the subpopulations from (A,B), respectively. Three and four different subpopulations respectively were identified depending on the range of values of dwel and doub. Blue boxes indicate low-infectivity subgroups, dark red boxes high infectivity subgroups and light red boxes indicate subpopulations that achieve high infectivity if the criterion inside the box is met.

