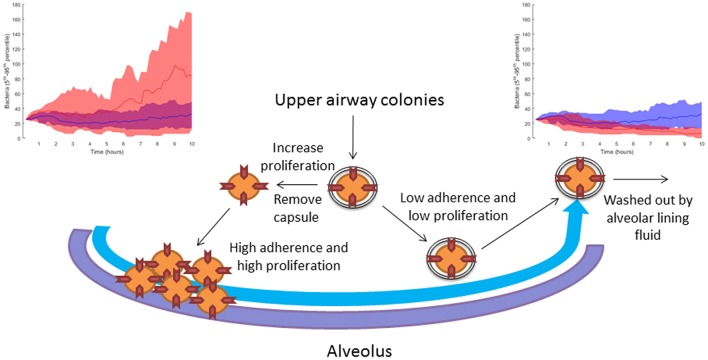
Figure 11.
Sketch of the modeling-based predicted strategies pursued by bacteria attempting to infect the alveoli. When the bacteria increase their proliferation rate and decrease their capsule production, they can accumulate in the alveolus due to higher adherence to the epithelial tissue. The top left-hand diagram shows in red 10 simulations with reduced capsule production (caps = 5 h) and increased proliferation (doub = 100 min), compared to 10 simulations of the nominal solution in blue (see section Materials and Methods). If the bacteria keep their initial upper-airway phenotype of low proliferation and capsule production, they are washed out by the lining fluid and do not succeed in infecting the alveolus. The top right-hand diagram shows in red 10 simulations with increased capsule production (caps = 2 h) and reduced proliferation (doub = 400 min) compared to 10 simulations of the nominal solution in blue (see section Materials and Methods).

