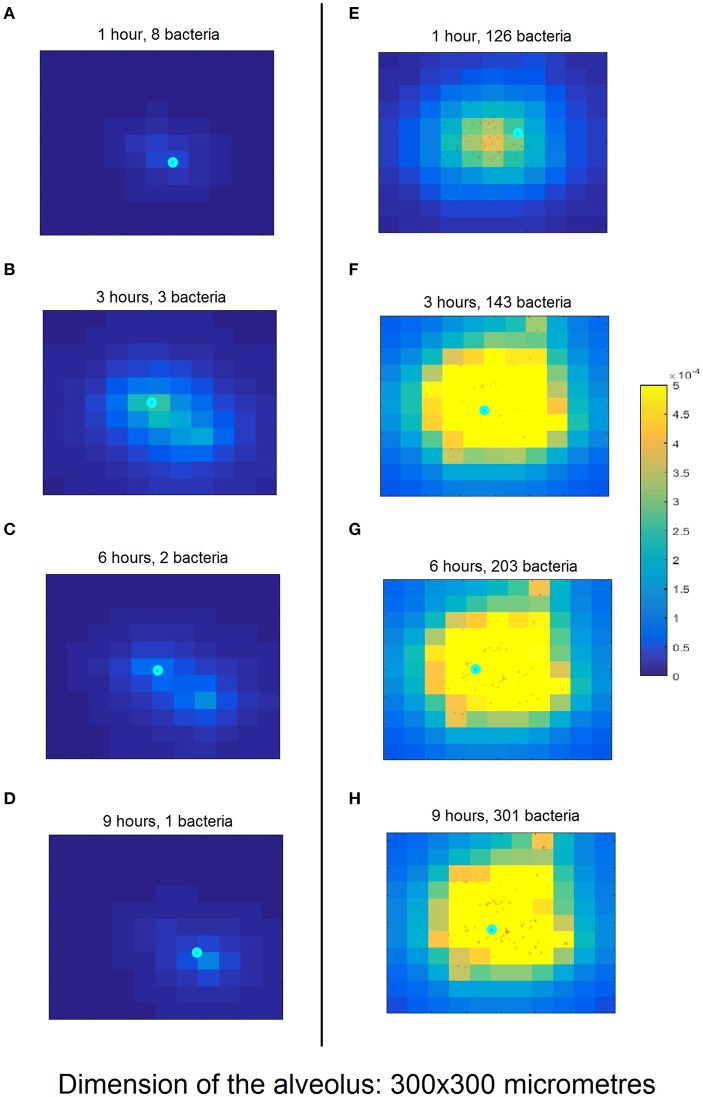
Figure 3.
Snapshots of simulation progression at 1, 3, 6, and 9 h (cf. rows from top to bottom) for the nominal model parametrization (A–D) compared to an exemplary successful infection (E–H). (A) The simulation was initiated with 10 bacteria (red dots) and one macrophage (cyan circle). The lighter background color around the bacteria represents the incipient production of MCP-1 from the epithelial cells (square domains in background) in this area. (B) The proliferating bacteria stimulate an increased release of MCP-1 and the macrophage follows the gradient. (C) The macrophage starts phagocytising the bacteria; the production of MCP-1 decreases. (D) The macrophage finds the last remaining bacteria and clears the infection. (E) The simulation begins with 100 bacteria which almost immediately trigger a strong chemokine release. (F) After 3 h and massive accumulation of MCP-1, the macrophage clears many bacteria. (G) The number of bacteria keeps increasing, dispersing across the alveolus. (H) After 10 h, the bacteria have spread through a wide area on the alveolus. The macrophage is not fast enough to clear all of them and the infection has become productive. Figure S3 provides a clearer representation of the small details of (H).

