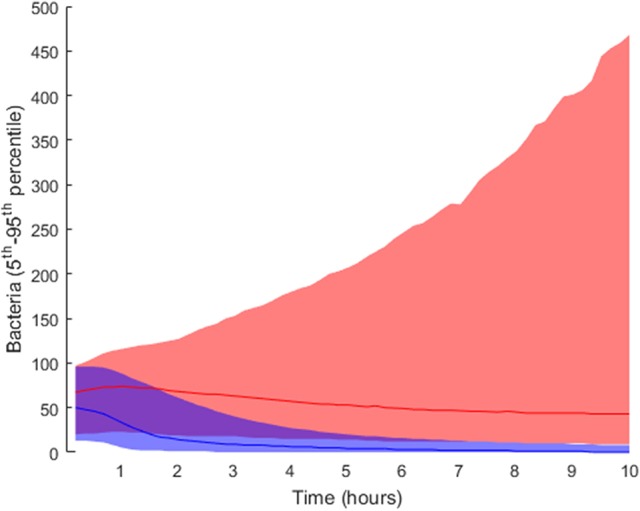
Figure 4.

Distribution of final bacteria numbers in the simulations accounting for the influence of tissue level parameters. The figure shows the evolution over time of the interpercentile range between the 5th and 95th percentiles in the two groups: high load group in pink and low load in blue. The solid lines in darker shades represent the median of each group.
