Figure 7.

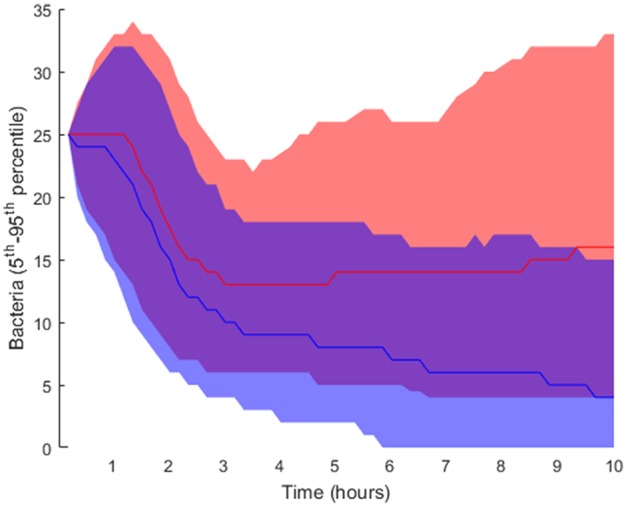
Interpercentile range between the 5th and 95th percentiles for final bacteria numbers of the intracellular-level solutions for the high load group in red and low load (blue). The lines represent the median of each distribution.

Interpercentile range between the 5th and 95th percentiles for final bacteria numbers of the intracellular-level solutions for the high load group in red and low load (blue). The lines represent the median of each distribution.