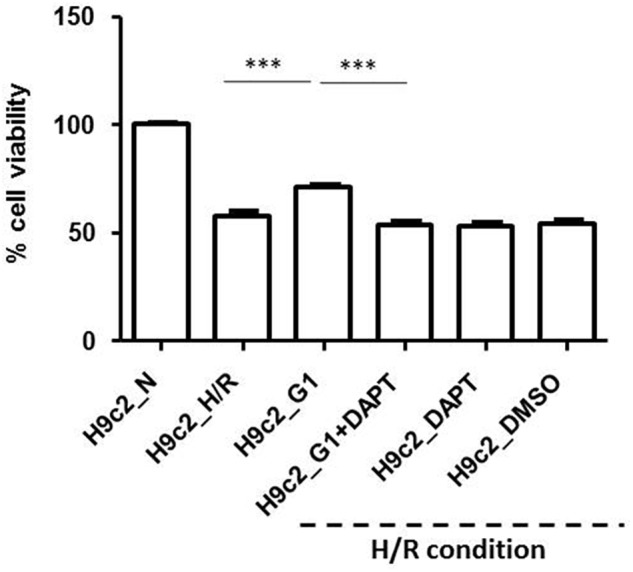
FIGURE 6.

Cell vitality in Normoxia (N) and Hypoxia/Reoxygenation (H/R) conditions. Data are presented as percentage variation with respect to mean value of cell count in normoxia, in control group. Treatment with G1 or G1 in the presence of Notch inhibitor (DAPT) in H/R conditions. Data of control I/R groups with DAPT and DMS are also reported. For acronyms see the text. ∗∗∗p < 0.001 vs. H9c2_N; ∗∗∗p < 0.001 H9c2_G1 vs. all other H/R conditions.
