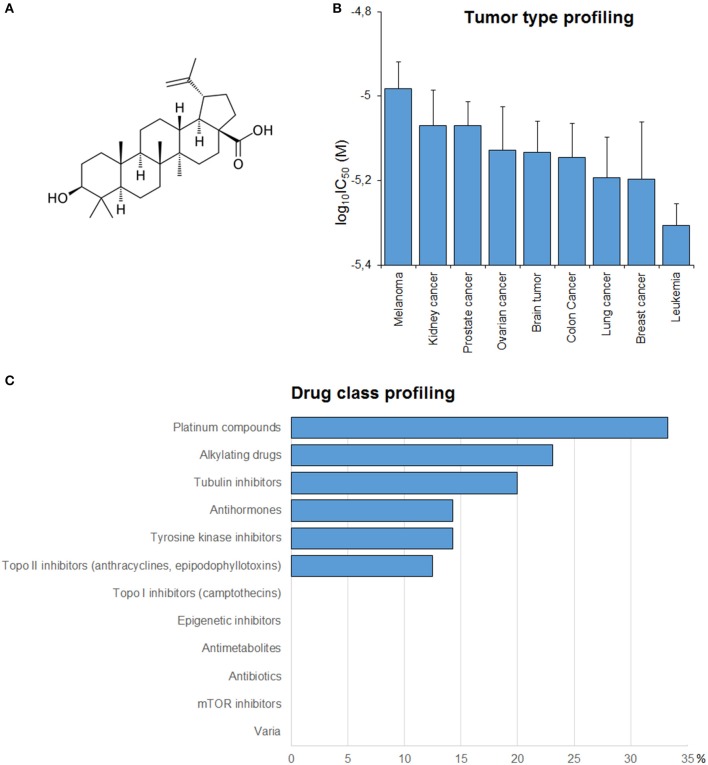
Figure 2.
(A) Chemical structure of BetA. (B) Mean log10IC50 values for BetA of the NCI cell lines, and S.E.M. log10IC50 values were grouped according to the tumor type of the cell lines. (C) Percentage of classes of established anticancer drugs, whose log10IC50 values correlate with those for BetA.

