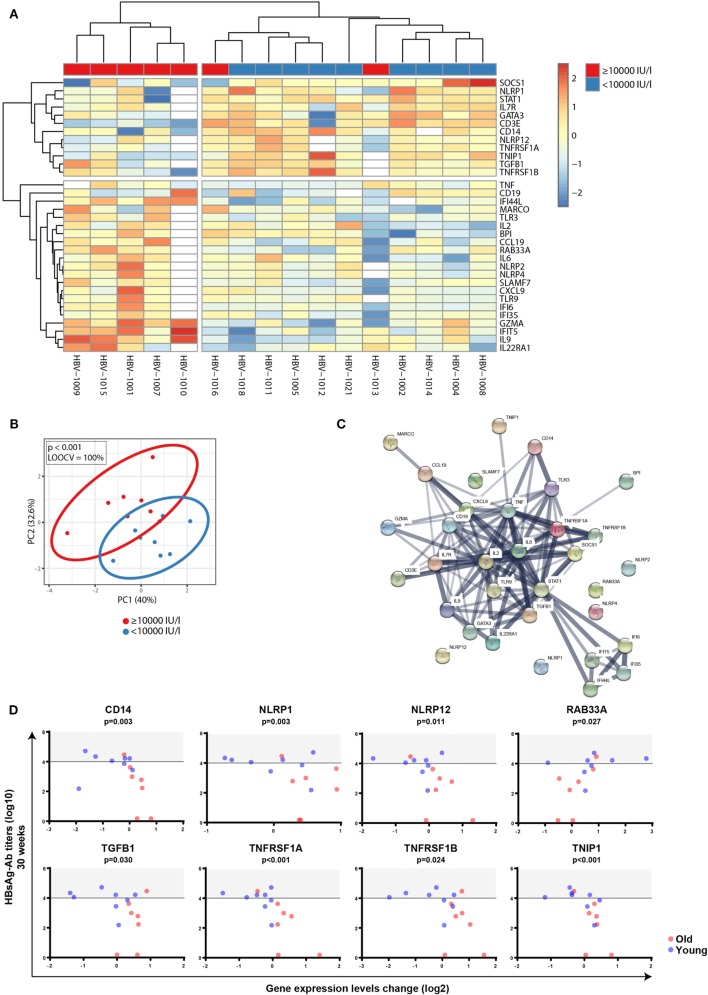
Figure 7.
Correlation between factorial changes (FCs) of transcriptomic profiles following primary vaccination and vaccine responsiveness. FCs of transcriptomic profiles between d0 and d1 were calculated following primary vaccination independent of age. Mann–Whitney U-test was used to identify transcripts that were differentially regulated between individuals with anti-HBs concentrations of ≥10,000 and <10,000 IU/l independent of age, and p-values were adjusted with the Benjamini–Hochberg method to correct for multiple testing. Using an FDR of <10% and an FC of >1.25, 33 transcripts were found to be differentially expressed between the two groups. (A) The median-centered gene expression of the 33-gene signature is represented using a blue to yellow to red color scale. Rows and columns correspond to the genes and the profiled samples, respectively. The vaccine responder groups are presented in colored squares above each sample. (B) PCA analysis of the gene expression profile of the 33-gene signature. Blue and red spheres represent individuals with anti-HBs concentrations of <10,000 and ≥10,000 IU/l, respectively. (C) String network analysis of the proteins represented in the 33-gene signature. Individual proteins are displayed as nodes. Lines represent protein–protein interactions, and the thickness of the lines indicates confidence. (D) Plots of the eight single genes that showed both a correlation between FCs of transcriptomic expression levels before and after vaccination (d0 and d1) (log2-transformed) and anti-HBs concentrations at week 30 (log10-transformed) following primary vaccination (4 weeks after the third dose) as well as a correlation with age. The horizontal line indicates an anti-HBs concentration of 10,000 IU/l used as a cutoff value to categorize participants, and the area above the cutoff value (>10,000 IU/l) is highlighted in gray. Blue and red spheres represent young and old adults, respectively.

