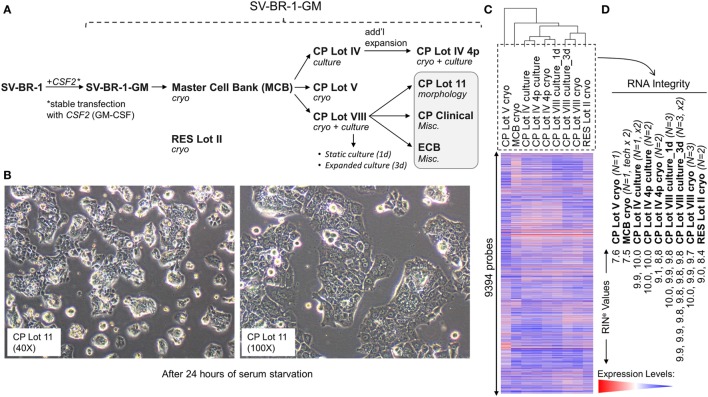
Figure 1.
Development of SV-BR-1-GM. (A) The SV-BR-1-GM cell line was derived from SV-BR-1 breast cancer cells following stable transfection with CSF2 [encoding human granulocyte–macrophage colony-stimulating factor (GM-CSF)]. The SV-BR-1 cell line itself was established from a chest wall lesion of a metastatic breast cancer patient (16, 17). The depicted developmental stages of SV-BR-1-GM represent samples used for this study rather than provide a comprehensive overview of all lots generated thus far. From an original master cell bank (MCB), several “clinical product” (CP) lots for actual or potential clinical use were established. “RES Lot II” refers to a research sample type and “ECB” to an engineering cell bank. RNA for gene expression analysis was extracted from cells taken directly from cryogenic vials (“cryo”) or following a culturing step (“culture”). “CP Lot VIII” was studied both as a presumptive static culture (“1d”) and as an expanded culture (“3d”), whereby for the former, samples were harvested on the first day (t = 0), and for the latter, on the third day (t = 2, i.e., 2 days later) of a time-course assessing GM-CSF secretion (outlined in Figure S5 in Supplementary Presentation S1 in Supplementary Material). Although no culture expansion took place from seeding to t = 0 (“static culture”), cell numbers of cultures harvested at t = 2 were 1.7–3.2 times the seeding cell numbers (“expanded culture”). (B) Culture morphology of SV-BR-1-GM, as exemplified by 40× and 100× original magnifications of a culture derived from the SV-BR-1-GM Lot 11 bank following 24 h of serum starvation. Of note, SV-BR-1-GM cells may grow in monolayers but can also grow as minimally adherent, sphere-like, structures, especially when seeded at very low densities. (C,D) Quality control (QC). (C) Hierarchical clustering of SV-BR-1-GM samples based on their microarray gene expression profiles. Normalized gene expression levels of samples belonging to the same sample type were averaged (arithmetic mean) prior to clustering. (D) Only samples with a RINe value of at least 7.5 were used for this study. Note that the CP Lot V cryo sample clustered separately and did not pass the minimal variability QC metric (see Materials and Methods) and was thus excluded from additional analyses.

