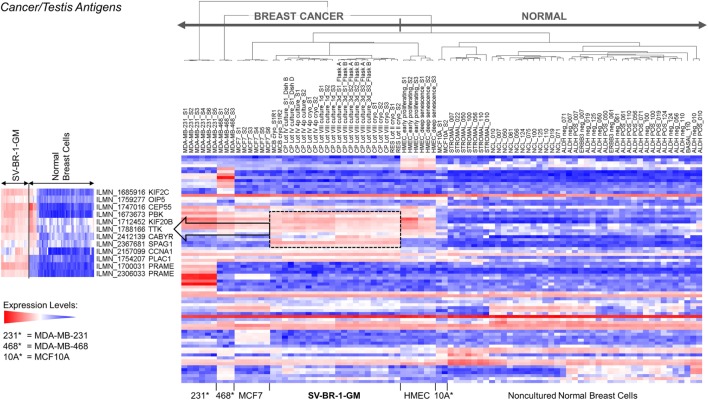
Figure 7.
Cancer/testis antigen (CTA) expression in SV-BR-1-GM cells. RNA expression levels of 279 confirmed or putative CTAs (Data Sheets S4 in Supplementary Material) were compared between SV-BR-1-GM, other established breast cancer cell lines, and several normal human breast cell types. Quantile-normalized and log2-transformed microarray-based RNA expression levels are displayed according to a global gradient color scheme. Red means a higher expression level than white, and white means a higher expression level than blue. Only CTAs with a maximum representative expression value among all samples >1.5 times the background cutoff value were included.

