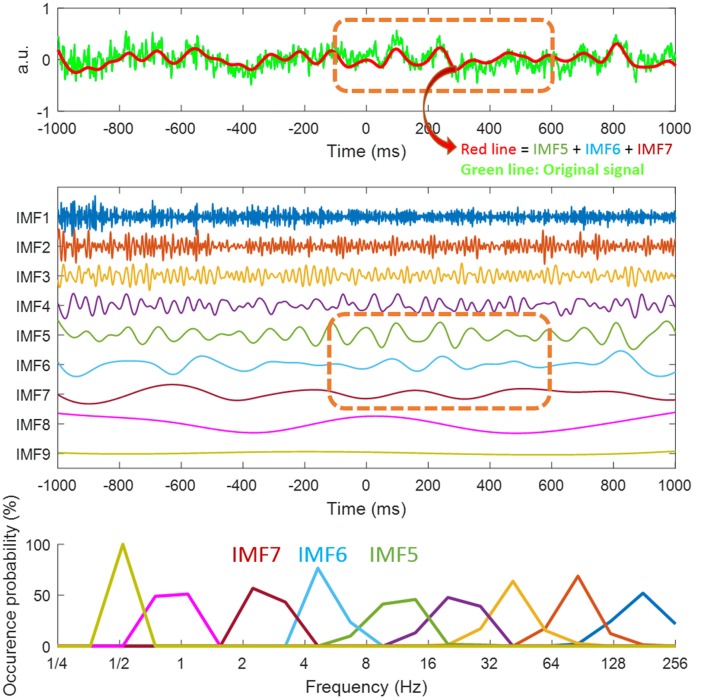
Figure 3.
Illustration of intrinsic mode functions (IMFs) from ensemble empirical mode decomposition (EEMD). Decomposition of the signal from the P3/P4 electrodes for target color (TC) conditions (the green line in top panel) through EEMD. We obtained nine IMFs (middle panel). For the first two graphs, the x-axis is time with 0 ms being the distractor onset. Different IMFs represented electrophysiological activities in different frequencies. For instance, IMF1 (1st IMF) was high frequency noise, IMF2 and IMF3 represented gamma activity and IMF4 was beta activity. Because the interested event-related potential (ERP) components (i.e., N2pc and Pd) in this study are all within low frequency range, we summed up IMF5, IMF6 and IMF7 (i.e., alpha, theta and delta activity) for the current event-related mode (ERM) analysis (the red line in the top graph). The last IMF (IMF 9) is the trend of the analyzed data. The orange dotted line (graphs 1 and 2) is the time window for ERM analysis. Bottom panel showed the distribution of instantaneous frequencies of each IMF.

