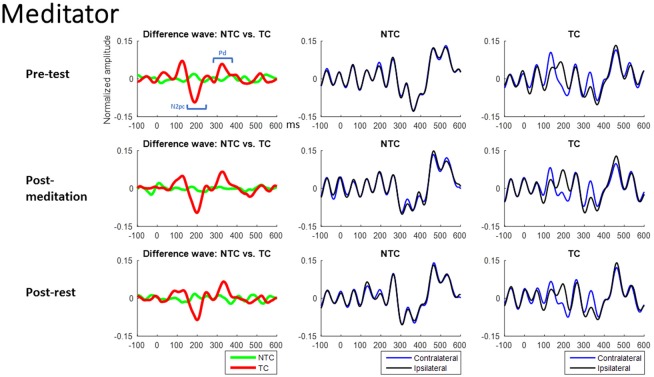
Figure 7.
Meditator group’s ERM waveforms from the RSVP task. The Waveforms of left Column were derived from the differences between contralateral and ipsilateral waveforms. The middle Column is the contralateral and ipsilateral waveforms of NTC condition. The right Column is the contralateral and ipsilateral waveforms of TC condition. The X-axis is time (ms), and 0 ms is distractor onset. The Y-axis is normalized amplitude. EEG data of all trials in each channel were normalized by dividing it into its standard deviation, therefore resulting in a unit-free measure of the amplitude.

