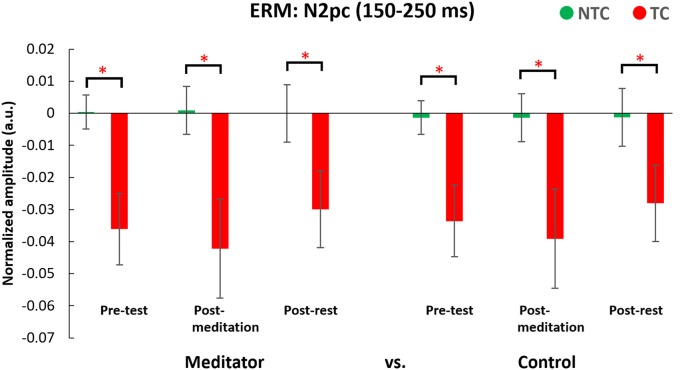
Figure 9.
Result for the N2pc component ERM analyses. N2pc values were significantly smaller in the TC condition than the NTC condition. Waveforms were derived from the differences between contralateral and ipsilateral waveforms. Error bars indicate 95% confidence intervals. The asterisks (*) indicate statistically significance differences (p < 0.05).

