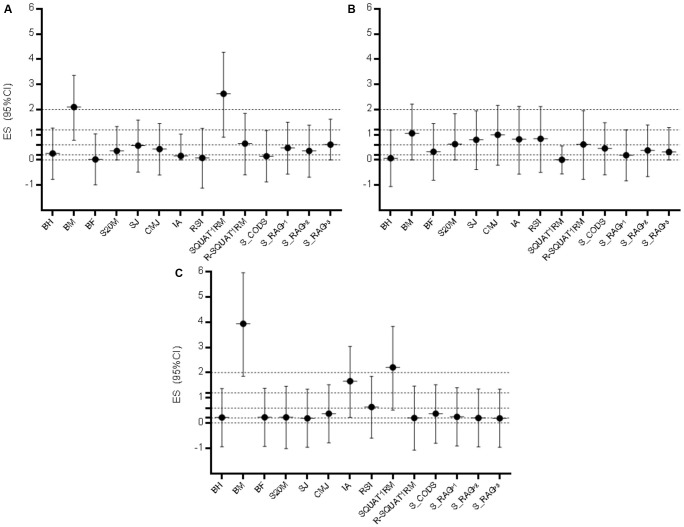
FIGURE 2.
Effect size differences (Cohen’s d ES) for the observed variables with 95% Confidence Intervals (95%CI) between (A) defenders and midfielders, (B) midfielders and forwards, and (C) defenders and forwards. BH, body height; BM, body mass; BF, body fat; S20M, sprint 20 m; SJ, squat jump; CMJ, Countermovement Jump; IA, index of asymmetry (the difference in the unilateral CMJ height between the legs); RSI, reactive strength index; SQUAT1RM, 1 repetition maximum in back squat, R-SQUAT1RM, relative strength in back squat; S_CODS, the soccer-specific change of direction speed test; S_RAG, the soccer-specific reactive-agility test; P1–P3, three different protocols of S_RAG; dashed lines present ES ranges (<0.02 = trivial; 0.2–0.6 = small; >0.6–1.2 = moderate; >1.2–2.0 = large; and >2.0 very large differences).

