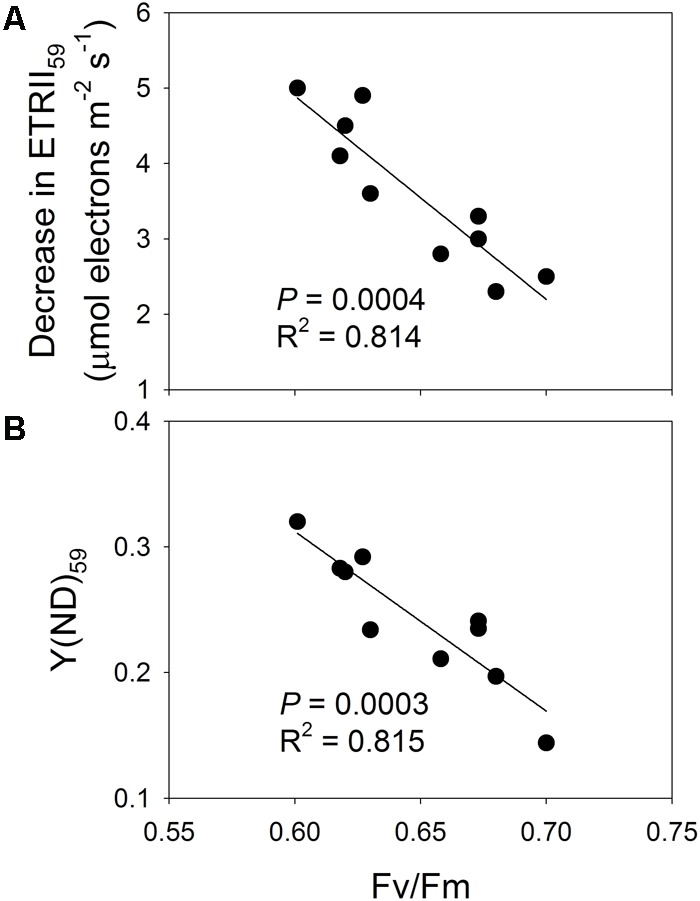
FIGURE 7.

(A) Relationship between Fv/Fm and decrease in ETRII59, and (B) relationship between Fv/Fm and Y(ND)59. Decrease in ETRII59 represents reduction in ETRII at 59 μmol photons m-2 s-1 after high-light treatments; Y(ND)59 is value for Y(ND) measured at 59 μmol photons m-2 s-1 after treatments.
