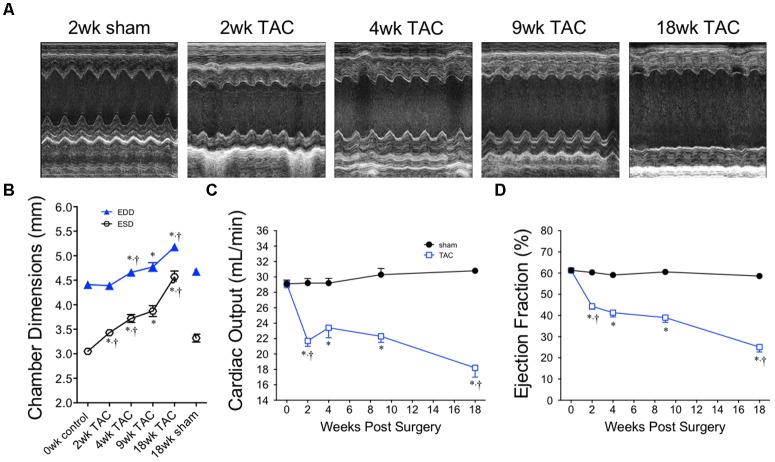
FIGURE 6.
Chamber size and echocardiographic function over 18 weeks of TAC. (A) Representative M-mode images acquired from the mid-papillary region of the LV. (B) Left ventricular end diastolic (EDD) and end systolic (ESD) dimensions, (C) cardiac output and (D) ejection fraction demonstrate dilation and a decline in cardiac function, especially between the 9 and 18 week time-points. Heart rate was statistically unchanged between all time points. ∗p < 0.01 vs. age-matched sham. †p < 0.01 vs. previous time point.

