FIGURE 7.
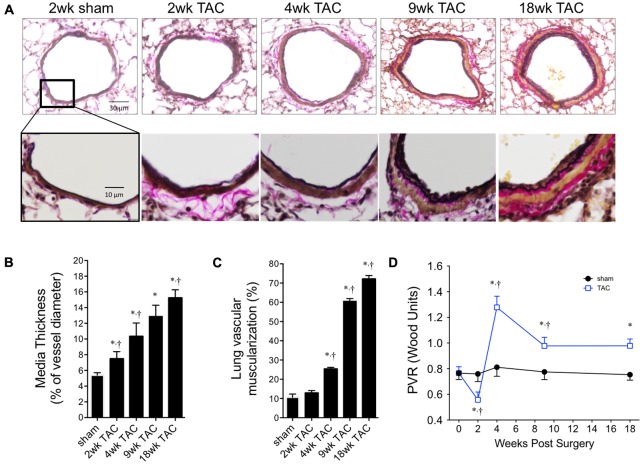
Pulmonary vascular remodeling over 18 weeks of TAC. (A) Representative cross-sectional images of whole pulmonary arteries (top panel) and vessel walls (bottom panel). (B) Thickness of vascular media was calculated as a percent of external diameter to normalize for varying vessel sizes. (C) Percent of muscularized small arterioles (<35 μm) in the lung. Sham values did not change over the 18 weeks study period and are represented as ‘sham’. (D) Pulmonary vascular resistance (PVR) was calculated from first principles; Resistance = ΔPressure/Flow. ΔPressure was the gradient between right ventricle systolic pressure and left ventricle end diastolic pressure. Flow was cardiac output. ∗p < 0.01 vs. age-matched sham. †p < 0.05 vs. previous time point.

