FIGURE 8.

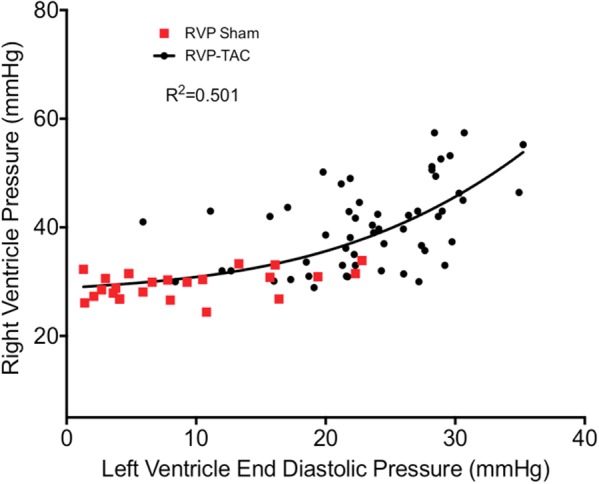
Correlation plot between right ventricle systolic pressure and left ventricular end diastolic pressure in both sham (n = 23) and TAC (n = 55). The curve of best fit was drawn using a non-linear third order polynomial (cubic) regression.

Correlation plot between right ventricle systolic pressure and left ventricular end diastolic pressure in both sham (n = 23) and TAC (n = 55). The curve of best fit was drawn using a non-linear third order polynomial (cubic) regression.