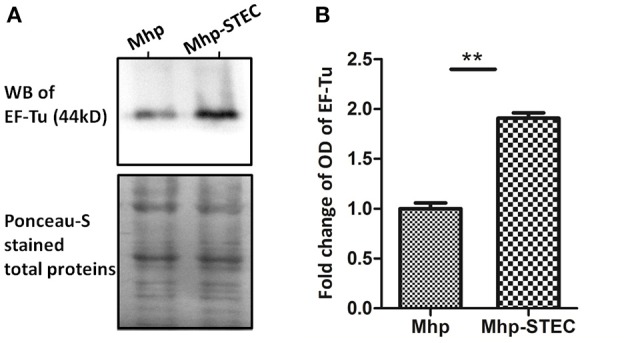
Figure 3.

Western blot analysis of the proteomics data. (A) Equal amounts (40 μg for each lane) of bacterial proteins from each sample were separated on a 12% SDS-PAGE gel and subjected to Ponceau-S stainning and western blot analysis. The left lane was loaded with the bacterial proteins of M. hyopneumoniae cultured in KM2 medium. The right lane was loaded with bacterial proteins of M. hyopneumoniae incubated with STEC. The differential abundance protein EF-Tu (44 kDa) was analyzed using its polyclonal antibody. The Ponceau-S stained membrane was used as the loading control. Protein bands were visualized using ECL substrate. (B) Image J software was used to calculate the optical density of the corresponding bands in the blots. The optical density of the corresponding bands was normalized to the total proteins of Ponceau-S staining of the same membrane. The level of abundance of EF-Tu in M. hyopneumoniae incubated with STEC is expressed as the percentage of that in M. hyopneumoniae cultured in KM2 medium. The asterisk above the charts stands for statistically significant differences.
