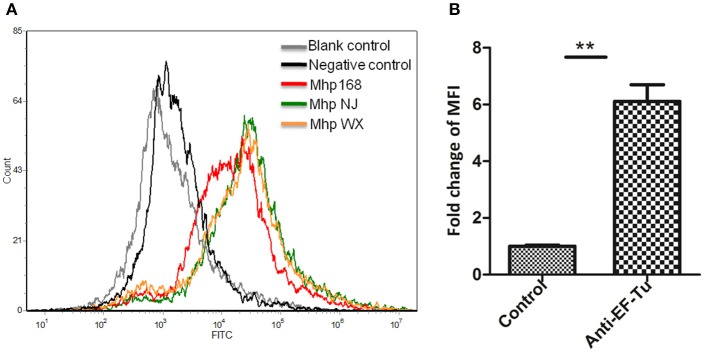
Figure 4.
Detection of M. hyopneumoniae EF-Tu surface display using flow cytometry. (A) Blank control, bacteria treated with PBS alone; negative control, bacteria treated with preimmune serum; Mhp strain 168, NJ, and WX: bacteria treated with anti-rEF-Tu serum. (B) The level of mean fluorescence intensity (MFI) of M. hyopneumoniae incubated with anti-rEF-Tu sera is expressed as the percentage of that incubated with preimmune sera. The asterisk above the charts stands for statistically significant differences.

