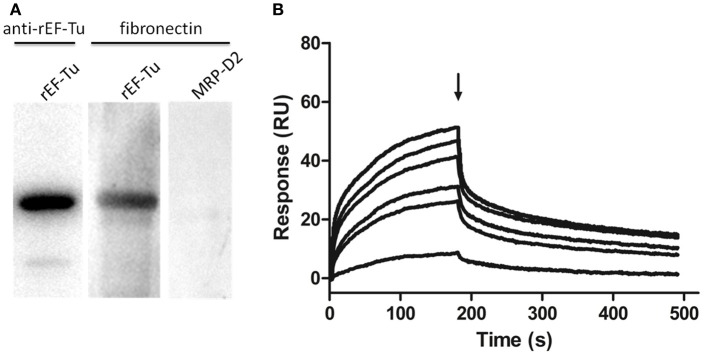
Figure 7.
rEF-Tu and fibronectin interaction analysis by Far-WB and SPR analysis. (A) Far-WB analysis of rEF-Tu with fibronectin. The first lane: PVDF membrane with transferred rEF-Tu protein incubated with anti- rEF-Tu antibody as a positive control; the second lane: PVDF membrane with transferred rEF-Tu protein incubated with fibronectin and anti-fibronectin antibody; the third lane: PVDF membrane with transferred a non-related recombinant protein MRP-D2 (negative control) incubated with fibronectin and anti-fibronectin antibody. Protein bands were visualized using ECL substrate. (B) Binding activity of rEF-Tu to fibronectin by SPR analysis. Sensorgrams depict binding of immobilized fibronectin by rEF-Tu. Increasing concentrations of the rEF-Tu was injected at 10, 25, 50, 100, 150, and 200 μg/mL at a flow rate of 30 μL/min for 180 s over immobilized fibronectin. Arrows indicate the end of the injection period at which point dissociation of rEF-Tu from fibronectin can be observed. The reaction is shown in resonance units (RU).

